This course will teach you how to use the Quantmod package.
Quantmod provides a framework for quantitative financial modeling and trading. It provides a rapid prototyping environment that makes modeling easier by removing the repetitive workflow issues surrounding data management and visualization.
Loading Data
# Loading package
library(quantmod)
# Get list of stock exchange symbols
symbols <- stockSymbols()
# Access financial information on Apple and Microsoft stocks
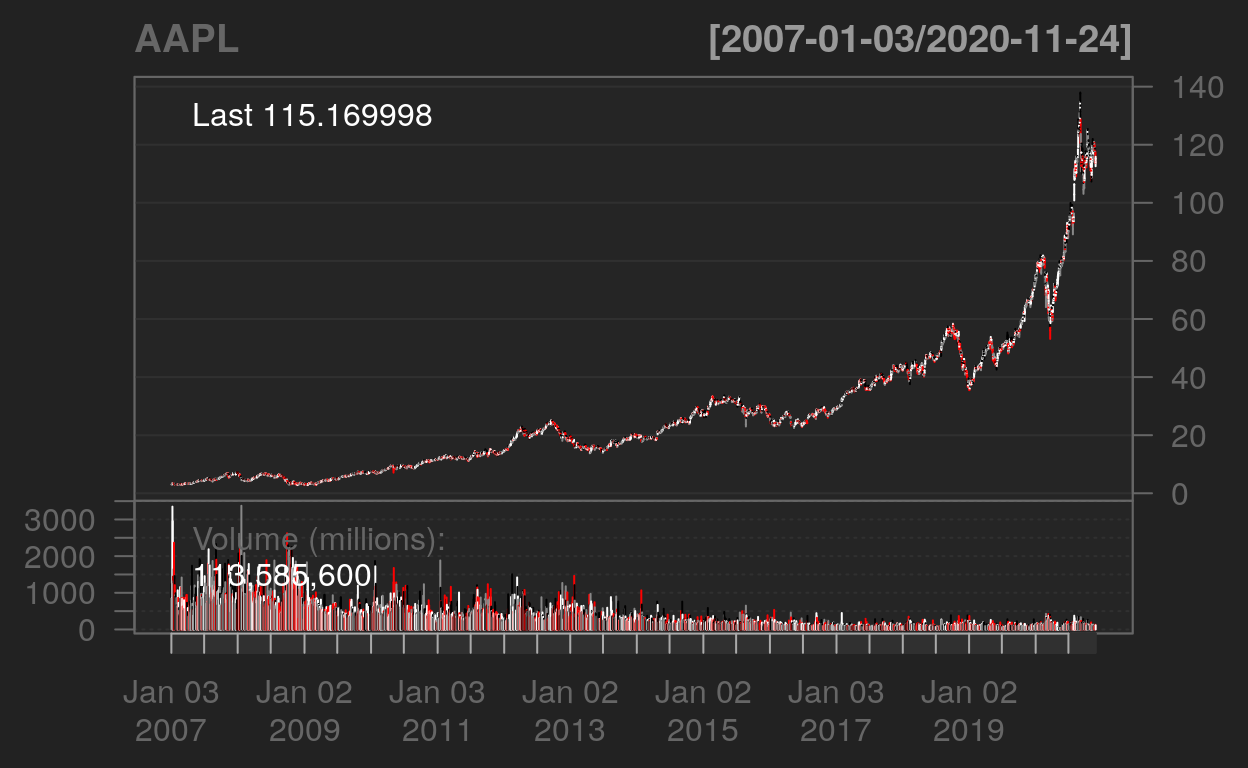
getSymbols("AAPL",src="yahoo")
[1] "AAPL"head(AAPL)
           AAPL.Open AAPL.High AAPL.Low AAPL.Close AAPL.Volume
2007-01-03  3.081786  3.092143 2.925000   2.992857  1238319600
2007-01-04  3.001786  3.069643 2.993572   3.059286   847260400
2007-01-05  3.063214  3.078571 3.014286   3.037500   834741600
2007-01-08  3.070000  3.090357 3.045714   3.052500   797106800
2007-01-09  3.087500  3.320714 3.041071   3.306072  3349298400
2007-01-10  3.383929  3.492857 3.337500   3.464286  2952880000
           AAPL.Adjusted
2007-01-03      2.560825
2007-01-04      2.617664
2007-01-05      2.599023
2007-01-08      2.611857
2007-01-09      2.828825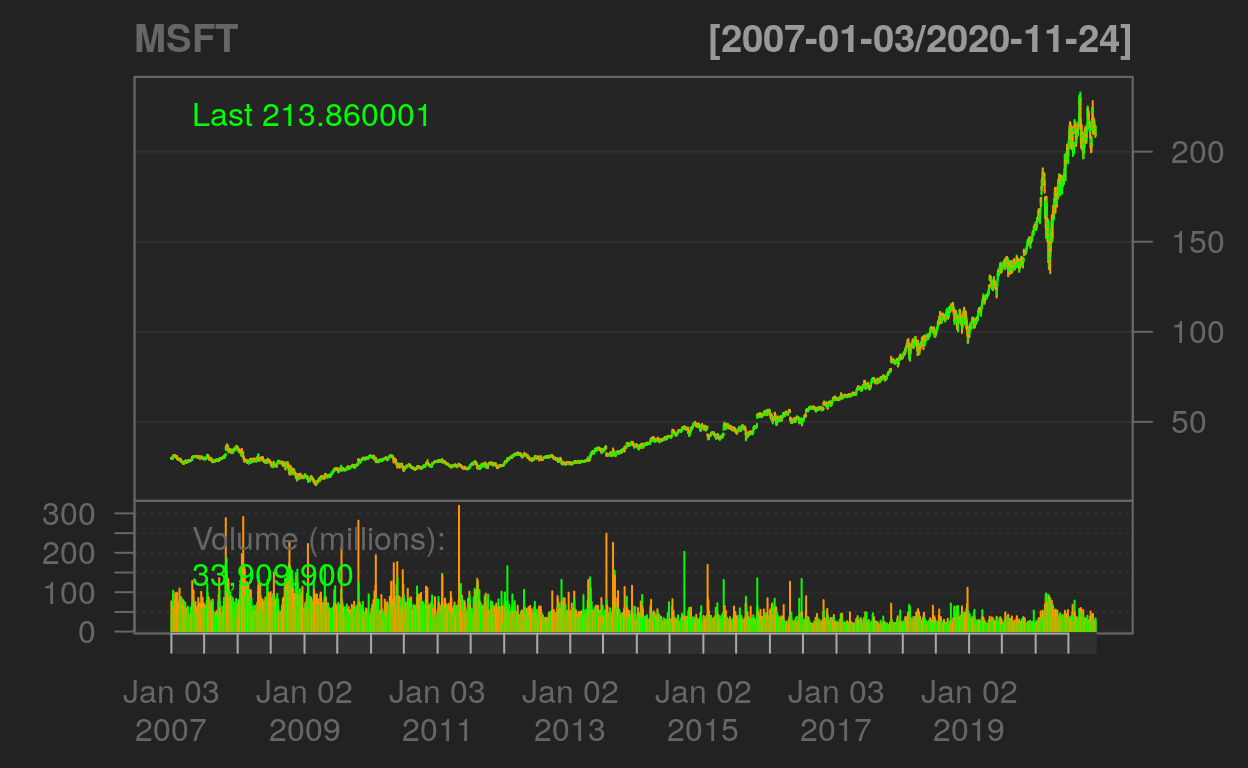
2007-01-10 2.964200getSymbols("MSFT",src="yahoo")
[1] "MSFT"head(MSFT)
           MSFT.Open MSFT.High MSFT.Low MSFT.Close MSFT.Volume
2007-01-03     29.91     30.25    29.40      29.86    76935100
2007-01-04     29.70     29.97    29.44      29.81    45774500
2007-01-05     29.63     29.75    29.45      29.64    44607200
2007-01-08     29.65     30.10    29.53      29.93    50220200
2007-01-09     30.00     30.18    29.73      29.96    44636600
2007-01-10     29.80     29.89    29.43      29.66    55017400
           MSFT.Adjusted
2007-01-03      22.01271
2007-01-04      21.97584
2007-01-05      21.85052
2007-01-08      22.06430
2007-01-09      22.08643
2007-01-10      21.86527
# Get the dividend data
getDividends("AAPL",src="yahoo", from = "2019-01-01", to = "2020-12-31", split.adjust = FALSE)
           AAPL.div
2019-02-08   0.1825
2019-05-10   0.1925
2019-08-09   0.1925
2019-11-07   0.1925
2020-02-07   0.1925
2020-05-08   0.8200
2020-08-07   0.2050
2020-11-06 0.2050getDividends("MSFT",src="yahoo", from = "2019-01-01", to = "2020-12-31", split.adjust = FALSE)
           MSFT.div
2019-02-20     0.46
2019-05-15     0.46
2019-08-14     0.46
2019-11-20     0.51
2020-02-19     0.51
2020-05-20     0.51
2020-08-19     0.51
2020-11-18     0.56
Visualizing Data
Downloading Data
# Download data

write.table(AAPL, file = "AAPL.csv", row.names=FALSE, col.names=TRUE, sep=",")

write.table(MSFT, file = "MSFT.csv", row.names=FALSE, col.names=TRUE, sep=",")