This course will teach you how to use the spiR package and create impactful visualizations with the Social Progress Index data.
Loading Data
Data Wrangling
spi_2014$value <- as.numeric(spi_2014$value)
Visualizing Data
kable(spi_2014)%>%
scroll_box(width = "100%", height = "200px")
| countryName | var_code | var_year | var_indicator | value |
|---|---|---|---|---|
| Brazil | BRA | 2014 | SPI | 73.59 |
| Canada | CAN | 2014 | SPI | 86.97 |
| China | CHN | 2014 | SPI | 61.58 |
| France | FRA | 2014 | SPI | 87.10 |
| South Africa | ZAF | 2014 | SPI | 64.65 |
| United States | USA | 2014 | SPI | 84.74 |
| Brazil | BRA | 2015 | SPI | 73.45 |
| Canada | CAN | 2015 | SPI | 87.17 |
| China | CHN | 2015 | SPI | 62.38 |
| France | FRA | 2015 | SPI | 87.19 |
| South Africa | ZAF | 2015 | SPI | 65.38 |
| United States | USA | 2015 | SPI | 84.71 |
| Brazil | BRA | 2016 | SPI | 74.12 |
| Canada | CAN | 2016 | SPI | 87.25 |
| China | CHN | 2016 | SPI | 62.89 |
| France | FRA | 2016 | SPI | 87.48 |
| South Africa | ZAF | 2016 | SPI | 66.19 |
| United States | USA | 2016 | SPI | 85.09 |
| Brazil | BRA | 2017 | SPI | 72.80 |
| Canada | CAN | 2017 | SPI | 87.79 |
| China | CHN | 2017 | SPI | 63.73 |
| France | FRA | 2017 | SPI | 87.60 |
| South Africa | ZAF | 2017 | SPI | 66.74 |
| United States | USA | 2017 | SPI | 84.18 |
| Brazil | BRA | 2018 | SPI | 72.66 |
| Canada | CAN | 2018 | SPI | 88.60 |
| China | CHN | 2018 | SPI | 64.16 |
| France | FRA | 2018 | SPI | 87.69 |
| South Africa | ZAF | 2018 | SPI | 66.56 |
| United States | USA | 2018 | SPI | 83.85 |
| Brazil | BRA | 2019 | SPI | 72.87 |
| Canada | CAN | 2019 | SPI | 88.81 |
| China | CHN | 2019 | SPI | 64.54 |
| France | FRA | 2019 | SPI | 87.79 |
| South Africa | ZAF | 2019 | SPI | 67.44 |
| United States | USA | 2019 | SPI | 83.62 |
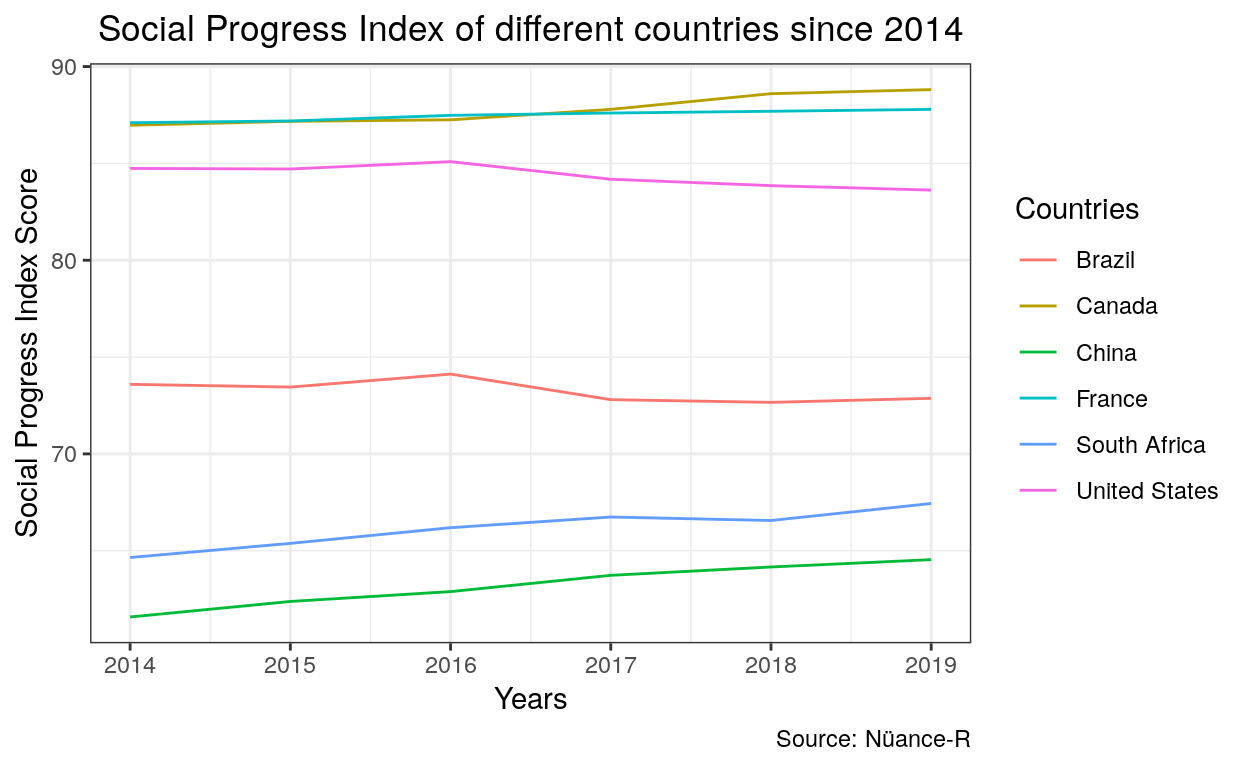
ggplot(data = spi_2014, aes(x = var_year, y = value, color = countryName)) +
  geom_line() +
  theme_bw() +
  theme(plot.title = element_text(hjust = 0.5)) +
  labs(title = "Social Progress Index of different countries since 2014",
       x = "Years",
       y = "Social Progress Index Score",
       colour = "Countries",
       caption = "Source: Nüance-R")
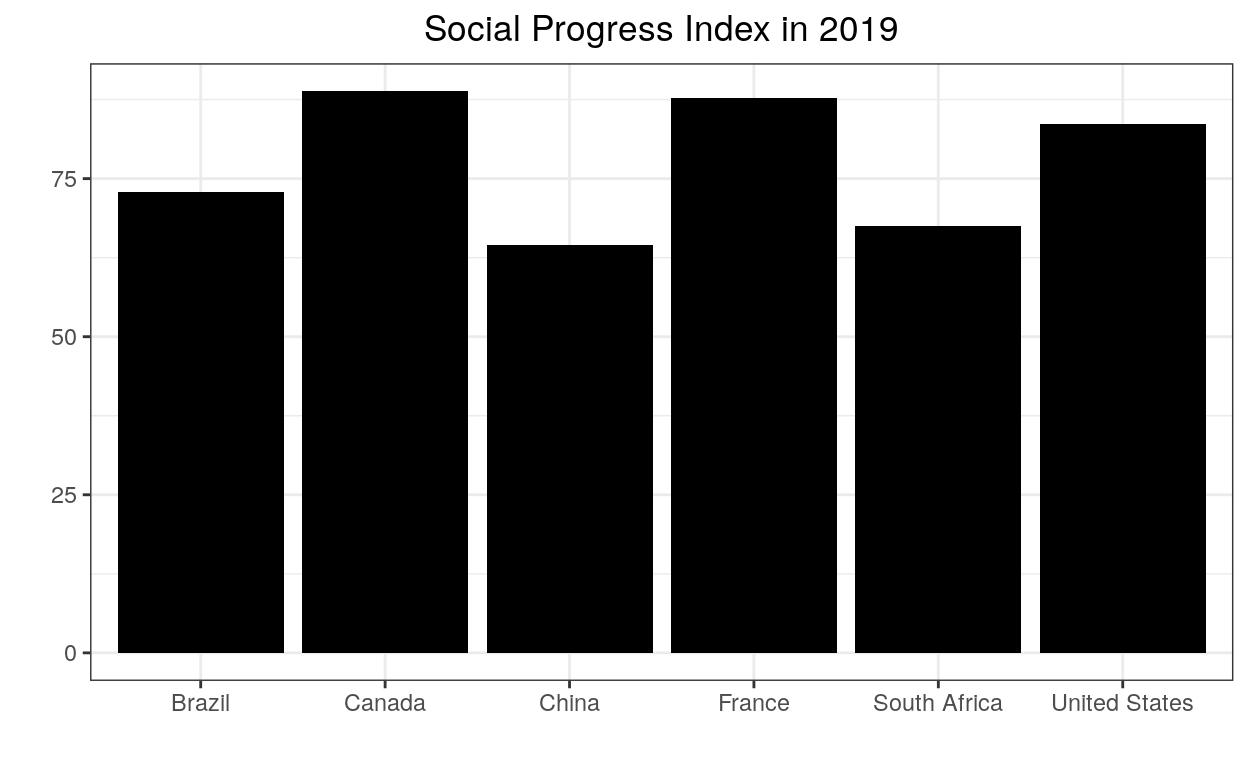
Another example
spi_2019$value <- as.numeric(spi_2019$value)
kable(spi_2019)%>%
scroll_box(width = "100%", height = "200px")
| countryName | var_code | var_year | var_indicator | value |
|---|---|---|---|---|
| Brazil | BRA | 2019 | SPI | 72.87 |
| Canada | CAN | 2019 | SPI | 88.81 |
| China | CHN | 2019 | SPI | 64.54 |
| France | FRA | 2019 | SPI | 87.79 |
| South Africa | ZAF | 2019 | SPI | 67.44 |
| United States | USA | 2019 | SPI | 83.62 |
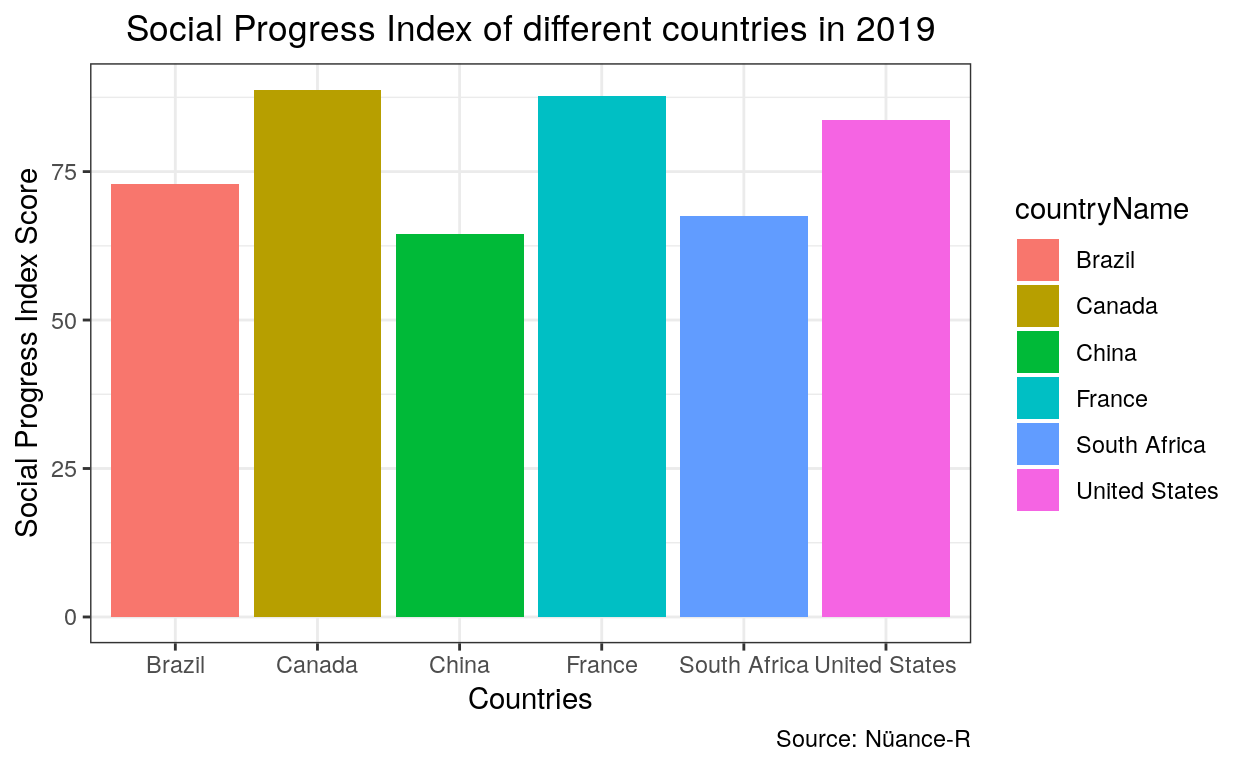
ggplot(data = spi_2019, aes(x = countryName, y = value, fill = countryName)) +
  geom_col() +
  theme_bw() +
  theme(plot.title = element_text(hjust = 0.5)) +
  labs(title = "Social Progress Index of different countries in 2019",
       x = "Countries",
       y = "Social Progress Index Score",
       colour = "Countries",
       caption = "Source: Nüance-R")