Introduction
What is Clustering?
Clustering is a machine learning technique that enables researchers and data scientists to partition and segment data. Segmenting data into appropriate groups is a core task when conducting exploratory analysis. This can be done in a number of ways, the two most popular being K-means and hierarchical clustering.
- Clustering is the classification of data objects into similarity groups (clusters) according to a defined distance measure.
- It is used in many fields, such as machine learning, data mining, pattern recognition, image analysis, genomics, systems biology, etc.
- Machine learning typically regards data clustering as a form of unsupervised learning.
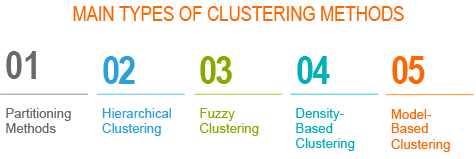
Types of clustering methods
- Partitioning methods
- Hierarchical clustering
- Fuzzy clustering
- Density-based clustering
- Model-based clustering
factoextra
The factoextra package provides many functions for computing and visualizing clusters. factoextra is an R package making easy to extract and visualize the output of exploratory multivariate data analyses.
Data preparation
# Invoke the following libraries
library(cluster)
library(factoextra)
library(magrittr)
library(ggplot2)
library(tidyr)
library(dplyr)
library(kableExtra)

# Load and prepare the data
data("USArrests")

my_data <- USArrests %>%
  na.omit() %>%          # Remove missing values (NA)
  scale()                # Scale variables

# View data
kable(my_data) %>%
  kable_styling() %>%
  scroll_box(width = "500px", height = "200px")
| Murder | Assault | UrbanPop | Rape | |
|---|---|---|---|---|
| Alabama | 1.2425641 | 0.7828393 | -0.5209066 | -0.0034165 |
| Alaska | 0.5078625 | 1.1068225 | -1.2117642 | 2.4842029 |
| Arizona | 0.0716334 | 1.4788032 | 0.9989801 | 1.0428784 |
| Arkansas | 0.2323494 | 0.2308680 | -1.0735927 | -0.1849166 |
| California | 0.2782682 | 1.2628144 | 1.7589234 | 2.0678203 |
| Colorado | 0.0257146 | 0.3988593 | 0.8608085 | 1.8649672 |
| Connecticut | -1.0304190 | -0.7290821 | 0.7917228 | -1.0817408 |
| Delaware | -0.4334739 | 0.8068381 | 0.4462940 | -0.5799463 |
| Florida | 1.7476714 | 1.9707777 | 0.9989801 | 1.1389667 |
| Georgia | 2.2068599 | 0.4828549 | -0.3827351 | 0.4877015 |
| Hawaii | -0.5712305 | -1.4970423 | 1.2062373 | -0.1101813 |
| Idaho | -1.1911350 | -0.6090884 | -0.7972496 | -0.7507699 |
| Illinois | 0.5997002 | 0.9388312 | 1.2062373 | 0.2955249 |
| Indiana | -0.1350014 | -0.6930840 | -0.0373063 | -0.0247694 |
| Iowa | -1.2829727 | -1.3770485 | -0.5899924 | -1.0603878 |
| Kansas | -0.4105145 | -0.6690853 | 0.0317794 | -0.3450638 |
| Kentucky | 0.4389842 | -0.7410815 | -0.9354212 | -0.5265639 |
| Louisiana | 1.7476714 | 0.9388312 | 0.0317794 | 0.1033483 |
| Maine | -1.3059321 | -1.0530653 | -1.0045069 | -1.4340645 |
| Maryland | 0.8063350 | 1.5507995 | 0.1008652 | 0.7012311 |
| Massachusetts | -0.7778653 | -0.2611064 | 1.3444088 | -0.5265639 |
| Michigan | 0.9900104 | 1.0108275 | 0.5844655 | 1.4806140 |
| Minnesota | -1.1681755 | -1.1850585 | 0.0317794 | -0.6760346 |
| Mississippi | 1.9083874 | 1.0588250 | -1.4881072 | -0.4411521 |
| Missouri | 0.2782682 | 0.0868755 | 0.3081225 | 0.7439370 |
| Montana | -0.4105145 | -0.7410815 | -0.8663354 | -0.5158874 |
| Nebraska | -0.8008247 | -0.8250772 | -0.2445636 | -0.5052109 |
| Nevada | 1.0129698 | 0.9748294 | 1.0680658 | 2.6443501 |
| New Hampshire | -1.3059321 | -1.3650491 | -0.6590781 | -1.2525644 |
| New Jersey | -0.0890826 | -0.1411127 | 1.6207519 | -0.2596519 |
| New Mexico | 0.8292944 | 1.3708088 | 0.3081225 | 1.1603196 |
| New York | 0.7604162 | 0.9988281 | 1.4134946 | 0.5197310 |
| North Carolina | 1.1966452 | 1.9947764 | -1.4190215 | -0.5479169 |
| North Dakota | -1.6044046 | -1.5090416 | -1.4881072 | -1.4874469 |
| Ohio | -0.1120420 | -0.6090884 | 0.6535513 | 0.0179365 |
| Oklahoma | -0.2727580 | -0.2371077 | 0.1699510 | -0.1315342 |
| Oregon | -0.6630682 | -0.1411127 | 0.1008652 | 0.8613783 |
| Pennsylvania | -0.3416362 | -0.7770796 | 0.4462940 | -0.6760346 |
| Rhode Island | -1.0074596 | 0.0388780 | 1.4825804 | -1.3806822 |
| South Carolina | 1.5180772 | 1.2988126 | -1.2117642 | 0.1353777 |
| South Dakota | -0.9156219 | -1.0170672 | -1.4190215 | -0.9002406 |
| Tennessee | 1.2425641 | 0.2068693 | -0.4518209 | 0.6051428 |
| Texas | 1.1277670 | 0.3628612 | 0.9989801 | 0.4556721 |
| Utah | -1.0533784 | -0.6090884 | 0.9989801 | 0.1780837 |
| Vermont | -1.2829727 | -1.4730435 | -2.3171363 | -1.0710643 |
| Virginia | 0.1634711 | -0.1771108 | -0.1754778 | -0.0567989 |
| Washington | -0.8697030 | -0.3091039 | 0.5153798 | 0.5304074 |
| West Virginia | -0.4793928 | -1.0770641 | -1.8335360 | -1.2739174 |
| Wisconsin | -1.1911350 | -1.4130466 | 0.0317794 | -1.1137702 |
| Wyoming | -0.2268391 | -0.1171139 | -0.3827351 | -0.6012993 |
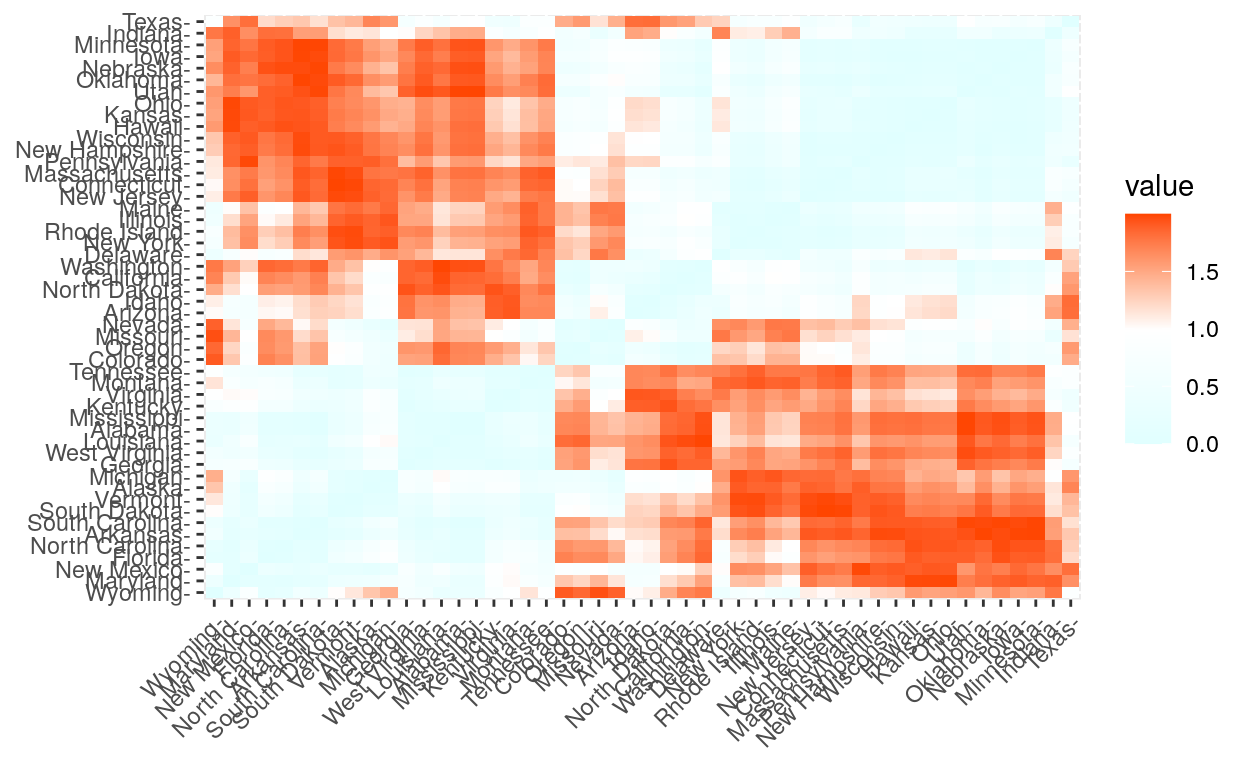
Distance measures
The common distance measures used for assessing similarity between observations.
get_dist(): for computing a distance matrix between the rows of a data matrix. Compared to the standard dist() function, it supports correlation-based distance measures including “pearson”, “kendall” and “spearman” methods.
fviz_dist(): for visualizing a distance matrix
res.dist <- get_dist(USArrests, stand = TRUE, method = "pearson")

fviz_dist(res.dist,
   gradient = list(low = "#E0FFFF", mid = "white", high = "#FF4500"))
Partitioning clustering
Technique to subdivide the data sets into a set of k groups, where k is the number of groups pre-specified by the analyst.
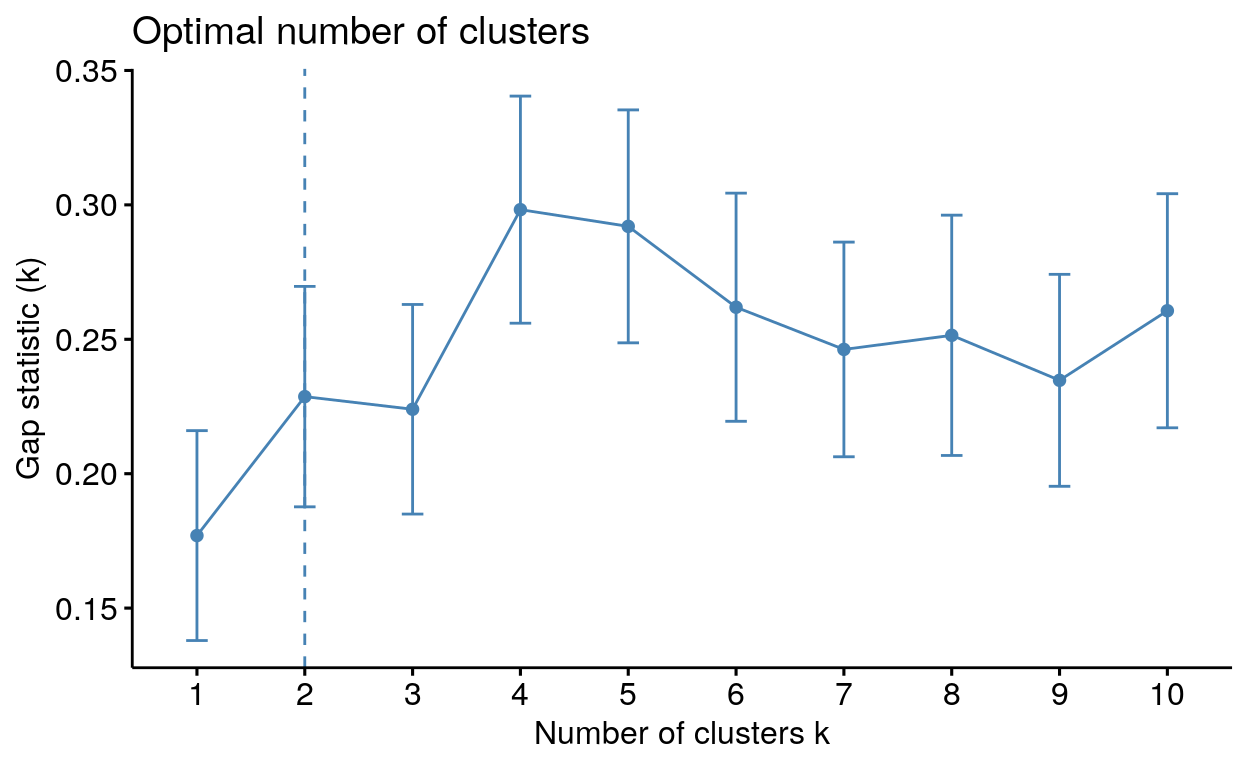
Determining the optimal number of clusters: fviz_nbclust()
fviz_nbclust(): Determines and visualizes the optimal number of clusters using different methods; within cluster sums of squares, average silhouette and gap statistics.
fviz_nbclust(my_data, kmeans, method = "gap_stat")
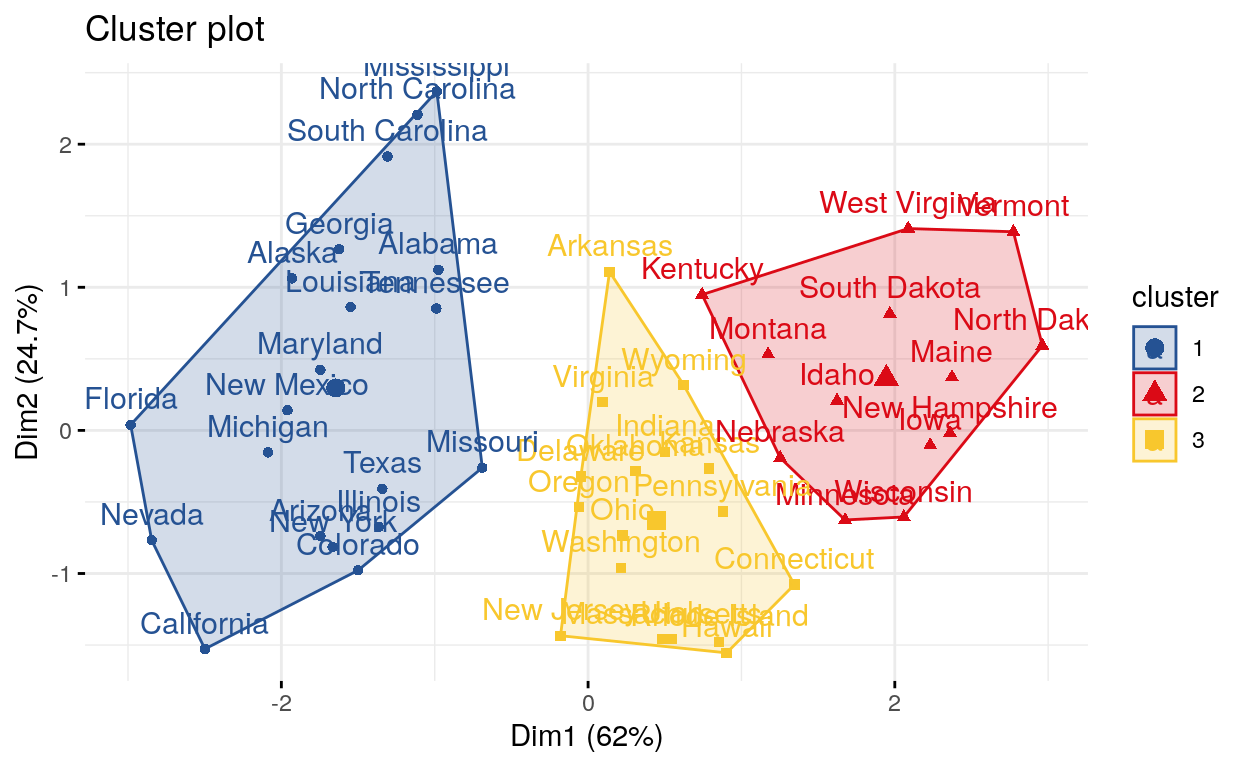
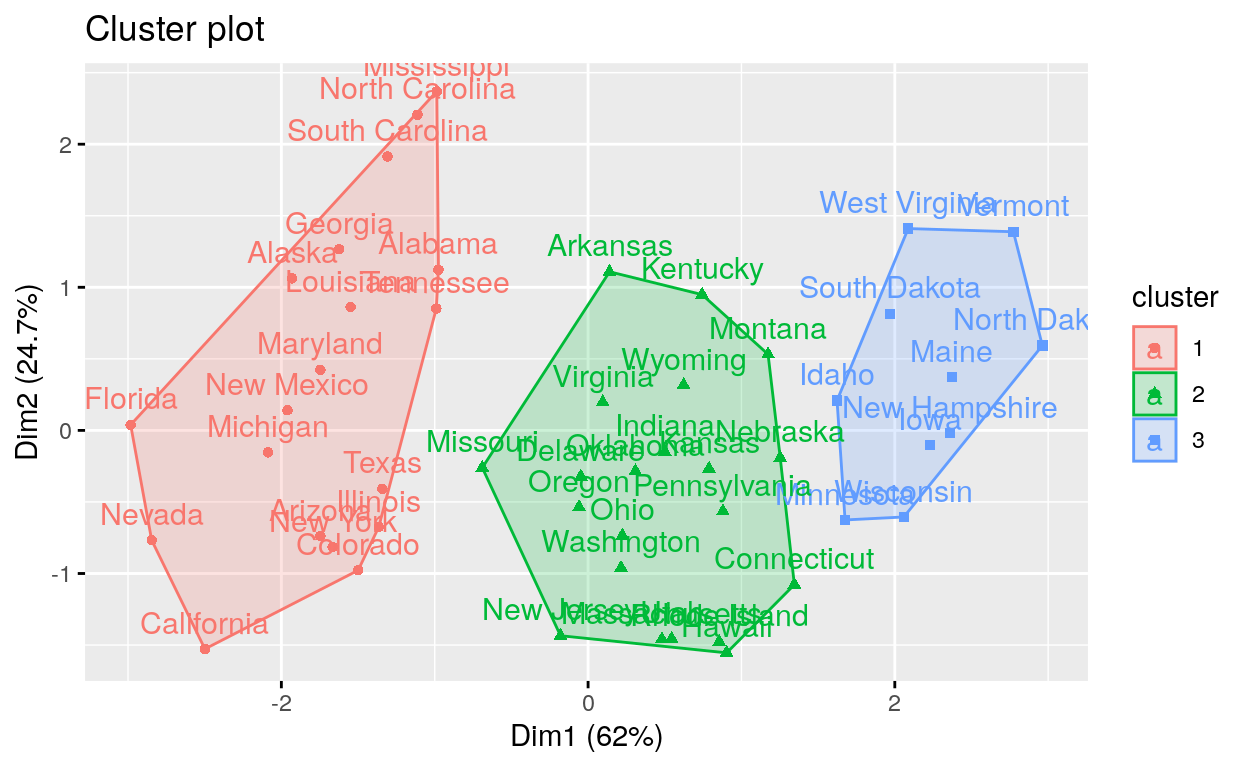
Compute and visualize k-means clustering
fviz_cluster(): Visualize Clustering Results
K-means > One of the more popular algorithms for clustering is K-means. It divides the observations into discrete groups based on some distance metric.
set.seed(123)
km.res <- kmeans(my_data, 3, nstart = 25)

palette <- c("#255293", "#db0a16", "#f8c72d")

# Visualize
library(factoextra)

fviz_cluster(km.res, data = my_data,
             ellipse.type = "convex",
             palette = palette,
             ggtheme = theme_minimal())
k-medoids/pam clustering
PAM > Two problems with K-means clustering are that it does not work with categorical data and it is susceptible to outliers. An alternative is K-medoids. Instead of the center of a cluster being the mean of the cluster, the center is one of the actual observations in the cluster. This is akin to the median, which is likewise robust against outliers. The most common K-medoids algorithm is Partitioning Around Medoids (PAM). The cluster package contains the pam function for performing Partitioning Around Medoids.
# Compute PAM
library(cluster)
pam.res <- pam(my_data, 3)

# Visualize
fviz_cluster(pam.res)
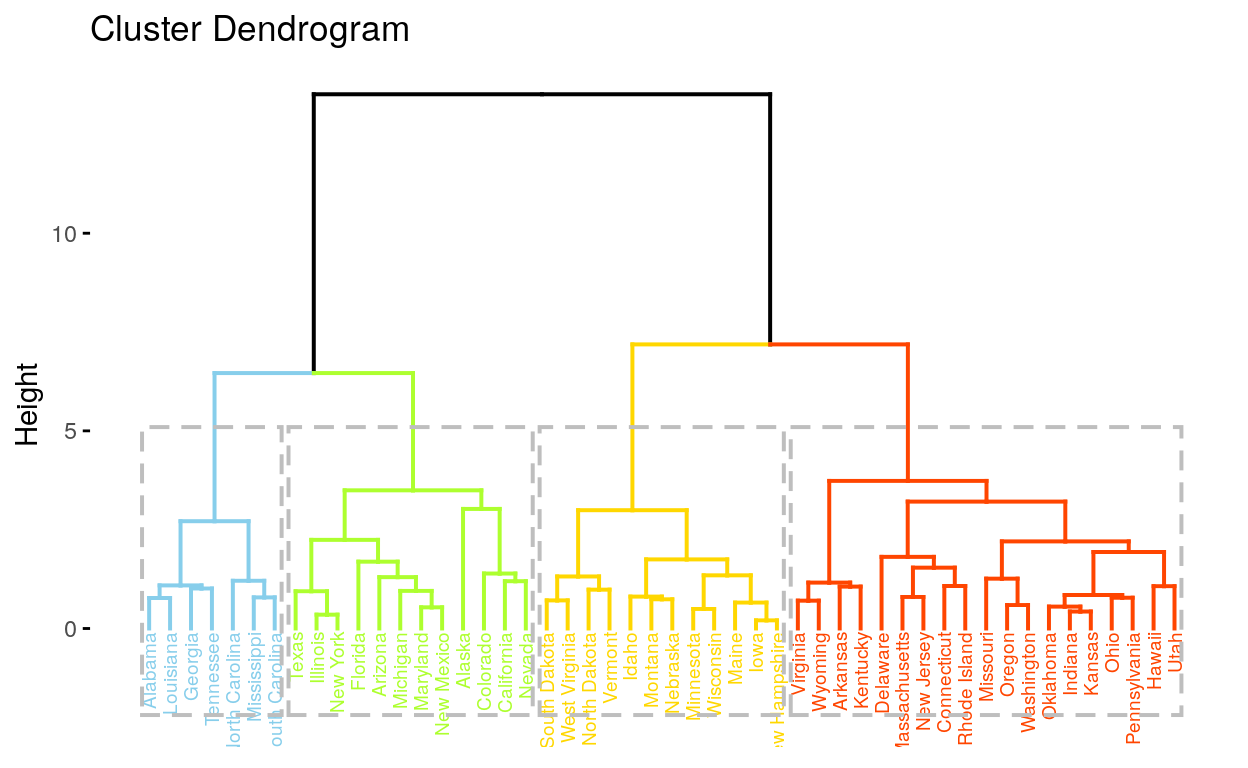
Hierarchical clustering
A tree-based representation of the objects, which is also known as dendrogram.
Hierarchical Clustering
Hierarchical clustering builds clusters within clusters, and does not require a pre-specified number of clusters like K-means and K-medoids do. A hierarchical clustering can be thought of as a tree and displayed as a dendrogram; at the top there is just one cluster consisting of all the observations, and at the bottom each observation is an entire cluster. In between are varying levels of clustering.
fviz_dend(): Enhanced Visualization Of Dendrogram
# Compute hierarchical clustering
res.hc <- USArrests %>%
  scale() %>%                    # Scale the data
  dist(method = "euclidean") %>% # Compute dissimilarity matrix
  hclust(method = "ward.D2")     # Compute hierachical clustering

# Visualize using factoextra
# Cut in 4 groups and color by groups
fviz_dend(res.hc, k = 4, # Cut in four groups
          cex = 0.5, # label size
          k_colors = c("#87CEEB", "#ADFF2F", "#FFD700", "#FF4500"),
          color_labels_by_k = TRUE, # color labels by groups
          rect = TRUE # Add rectangle around groups
          )
Conclusion
Clustering is a popular technique for segmenting data. The primary options for clustering in R are : kmeans for K-means, pam in cluster for K-medoids, and hclust for hierarchical clustering.We hope this tutorial helped you understand how to use each methods of clustering.
Sources
- factoextra : Extract and Visualize the Results of Multivariate Data Analyses
- TYPES OF CLUSTERING METHODS: OVERVIEW AND QUICK START R CODE
- A Simple Exercise with Cluster Analysis Using the factoextra R Package
- Cluster Analysis in R
- Clustering in R