Learn the key ideas behind pivot_longer() and pivot_wider() as you see them used to solve a variety of data reshaping challenges ranging from simple to complex.
Data structure
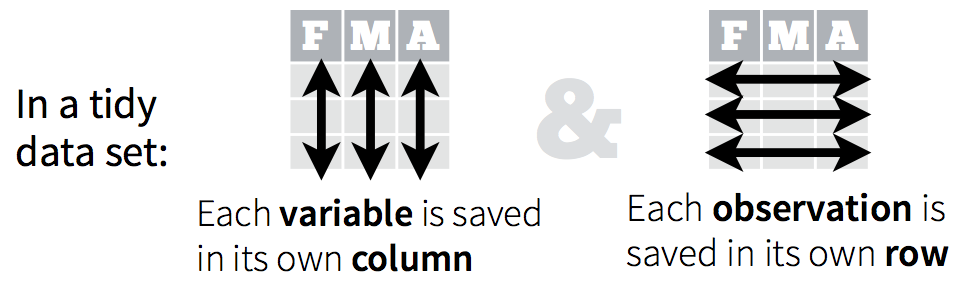
Most statistical datasets are data frames made up of rows and columns. The columns are almost always labeled and the rows are sometimes labeled.
Load Packages
Pivot_longer()
pivot_longer() makes datasets longer by increasing the number of rows and decreasing the number of columns. pivot_longer() is commonly needed to tidy wild-caught datasets as they often optimise for ease of data entry or ease of comparison rather than ease of analysis
# use the relig_income dataframe
relig_income
# A tibble: 18 x 11
   religion `<$10k` `$10-20k` `$20-30k` `$30-40k` `$40-50k` `$50-75k`
   <chr>      <dbl>     <dbl>     <dbl>     <dbl>     <dbl>     <dbl>
 1 Agnostic      27        34        60        81        76       137
 2 Atheist       12        27        37        52        35        70
 3 Buddhist      27        21        30        34        33        58
 4 Catholic     418       617       732       670       638      1116
 5 Don’t k…      15        14        15        11        10        35
 6 Evangel…     575       869      1064       982       881      1486
 7 Hindu          1         9         7         9        11        34
 8 Histori…     228       244       236       238       197       223
 9 Jehovah…      20        27        24        24        21        30
10 Jewish        19        19        25        25        30        95
11 Mainlin…     289       495       619       655       651      1107
12 Mormon        29        40        48        51        56       112
13 Muslim         6         7         9        10         9        23
14 Orthodox      13        17        23        32        32        47
15 Other C…       9         7        11        13        13        14
16 Other F…      20        33        40        46        49        63
17 Other W…       5         2         3         4         2         7
18 Unaffil…     217       299       374       365       341       528
# … with 4 more variables: `$75-100k` <dbl>, `$100-150k` <dbl>,
#   `>150k` <dbl>, `Don't know/refused` <dbl>
# pivot_longer
relig_income %>%
pivot_longer(-religion, names_to = "income", values_to = "count")
# A tibble: 180 x 3
   religion income             count
   <chr>    <chr>              <dbl>
 1 Agnostic <$10k                 27
 2 Agnostic $10-20k               34
 3 Agnostic $20-30k               60
 4 Agnostic $30-40k               81
 5 Agnostic $40-50k               76
 6 Agnostic $50-75k              137
 7 Agnostic $75-100k             122
 8 Agnostic $100-150k            109
 9 Agnostic >150k                 84
10 Agnostic Don't know/refused    96
# … with 170 more rows
Pivot_wider()
pivot_wider() is the opposite of pivot_longer(): it makes a dataset wider by increasing the number of columns and decreasing the number of rows. it’s often useful for creating summary tables for presentation, or data in a format needed by other tools
# use the fish_encouters dataframe
fish_encounters
# A tibble: 114 x 3
   fish  station  seen
   <fct> <fct>   <int>
 1 4842  Release     1
 2 4842  I80_1       1
 3 4842  Lisbon      1
 4 4842  Rstr        1
 5 4842  Base_TD     1
 6 4842  BCE         1
 7 4842  BCW         1
 8 4842  BCE2        1
 9 4842  BCW2        1
10 4842  MAE         1
# … with 104 more rows
# pivot_wider
fish_encounters %>%
pivot_wider(names_from = station, values_from = seen)
# A tibble: 19 x 12
   fish  Release I80_1 Lisbon  Rstr Base_TD   BCE   BCW  BCE2  BCW2
   <fct>   <int> <int>  <int> <int>   <int> <int> <int> <int> <int>
 1 4842        1     1      1     1       1     1     1     1     1
 2 4843        1     1      1     1       1     1     1     1     1
 3 4844        1     1      1     1       1     1     1     1     1
 4 4845        1     1      1     1       1    NA    NA    NA    NA
 5 4847        1     1      1    NA      NA    NA    NA    NA    NA
 6 4848        1     1      1     1      NA    NA    NA    NA    NA
 7 4849        1     1     NA    NA      NA    NA    NA    NA    NA
 8 4850        1     1     NA     1       1     1     1    NA    NA
 9 4851        1     1     NA    NA      NA    NA    NA    NA    NA
10 4854        1     1     NA    NA      NA    NA    NA    NA    NA
11 4855        1     1      1     1       1    NA    NA    NA    NA
12 4857        1     1      1     1       1     1     1     1     1
13 4858        1     1      1     1       1     1     1     1     1
14 4859        1     1      1     1       1    NA    NA    NA    NA
15 4861        1     1      1     1       1     1     1     1     1
16 4862        1     1      1     1       1     1     1     1     1
17 4863        1     1     NA    NA      NA    NA    NA    NA    NA
18 4864        1     1     NA    NA      NA    NA    NA    NA    NA
19 4865        1     1      1    NA      NA    NA    NA    NA    NA
# … with 2 more variables: MAE <int>, MAW <int>
# clean data and replace NA values by 0
fish_encounters %>%
pivot_wider(
names_from = station,
values_from = seen,
values_fill = list(seen = 0)
)
# A tibble: 19 x 12
   fish  Release I80_1 Lisbon  Rstr Base_TD   BCE   BCW  BCE2  BCW2
   <fct>   <int> <int>  <int> <int>   <int> <int> <int> <int> <int>
 1 4842        1     1      1     1       1     1     1     1     1
 2 4843        1     1      1     1       1     1     1     1     1
 3 4844        1     1      1     1       1     1     1     1     1
 4 4845        1     1      1     1       1     0     0     0     0
 5 4847        1     1      1     0       0     0     0     0     0
 6 4848        1     1      1     1       0     0     0     0     0
 7 4849        1     1      0     0       0     0     0     0     0
 8 4850        1     1      0     1       1     1     1     0     0
 9 4851        1     1      0     0       0     0     0     0     0
10 4854        1     1      0     0       0     0     0     0     0
11 4855        1     1      1     1       1     0     0     0     0
12 4857        1     1      1     1       1     1     1     1     1
13 4858        1     1      1     1       1     1     1     1     1
14 4859        1     1      1     1       1     0     0     0     0
15 4861        1     1      1     1       1     1     1     1     1
16 4862        1     1      1     1       1     1     1     1     1
17 4863        1     1      0     0       0     0     0     0     0
18 4864        1     1      0     0       0     0     0     0     0
19 4865        1     1      1     0       0     0     0     0     0
# … with 2 more variables: MAE <int>, MAW <int>
Aggregation
You can use pivot_wider() to perform simple aggregation.
# use the warpbreaks dataset
warpbreaks <- warpbreaks %>% as_tibble() %>% select(wool, tension, breaks)
warpbreaks
# A tibble: 54 x 3
   wool  tension breaks
   <fct> <fct>    <dbl>
 1 A     L           26
 2 A     L           30
 3 A     L           54
 4 A     L           25
 5 A     L           70
 6 A     L           52
 7 A     L           51
 8 A     L           26
 9 A     L           67
10 A     M           18
# … with 44 more rows
warpbreaks %>% count(wool, tension)
# A tibble: 6 x 3
  wool  tension     n
  <fct> <fct>   <int>
1 A     L           9
2 A     M           9
3 A     H           9
4 B     L           9
5 B     M           9
6 B     H           9
# pivot the levels of wool into the columns
warpbreaks %>% pivot_wider(names_from = wool, values_from = breaks)
# A tibble: 3 x 3
  tension A         B
  <fct>   <list>    <list>
1 L       <dbl [9]> <dbl [9]>
2 M       <dbl [9]> <dbl [9]>
3 H       <dbl [9]> <dbl [9]>
# mean breaks for each combination of wool and tension
warpbreaks %>%
pivot_wider(
names_from = wool,
values_from = breaks,
values_fn = list(breaks = mean)
)
# A tibble: 3 x 3
  tension     A     B
  <fct>   <dbl> <dbl>
1 L        44.6  28.2
2 M        24    28.8
3 H        24.6  18.8
Longer, then wider
Some problems can’t be solved by pivotting in a single direction. This section shows you how to combine pivot_longer() and pivot_wider() to solve more complex problems.
# use the world_bank_pop dataframe
world_bank_pop
# A tibble: 1,056 x 20
   country indicator `2000` `2001` `2002` `2003`  `2004`  `2005`
   <chr>   <chr>      <dbl>  <dbl>  <dbl>  <dbl>   <dbl>   <dbl>
 1 ABW     SP.URB.T… 4.24e4 4.30e4 4.37e4 4.42e4 4.47e+4 4.49e+4
 2 ABW     SP.URB.G… 1.18e0 1.41e0 1.43e0 1.31e0 9.51e-1 4.91e-1
 3 ABW     SP.POP.T… 9.09e4 9.29e4 9.50e4 9.70e4 9.87e+4 1.00e+5
 4 ABW     SP.POP.G… 2.06e0 2.23e0 2.23e0 2.11e0 1.76e+0 1.30e+0
 5 AFG     SP.URB.T… 4.44e6 4.65e6 4.89e6 5.16e6 5.43e+6 5.69e+6
 6 AFG     SP.URB.G… 3.91e0 4.66e0 5.13e0 5.23e0 5.12e+0 4.77e+0
 7 AFG     SP.POP.T… 2.01e7 2.10e7 2.20e7 2.31e7 2.41e+7 2.51e+7
 8 AFG     SP.POP.G… 3.49e0 4.25e0 4.72e0 4.82e0 4.47e+0 3.87e+0
 9 AGO     SP.URB.T… 8.23e6 8.71e6 9.22e6 9.77e6 1.03e+7 1.09e+7
10 AGO     SP.URB.G… 5.44e0 5.59e0 5.70e0 5.76e0 5.75e+0 5.69e+0
# … with 1,046 more rows, and 12 more variables: `2006` <dbl>,
#   `2007` <dbl>, `2008` <dbl>, `2009` <dbl>, `2010` <dbl>,
#   `2011` <dbl>, `2012` <dbl>, `2013` <dbl>, `2014` <dbl>,
#   `2015` <dbl>, `2016` <dbl>, `2017` <dbl>
# year is spread across multiple columns.
pop2 <- world_bank_pop %>%
pivot_longer(`2000`:`2017`, names_to = "year", values_to = "value")
pop2
# A tibble: 19,008 x 4
   country indicator   year  value
   <chr>   <chr>       <chr> <dbl>
 1 ABW     SP.URB.TOTL 2000  42444
 2 ABW     SP.URB.TOTL 2001  43048
 3 ABW     SP.URB.TOTL 2002  43670
 4 ABW     SP.URB.TOTL 2003  44246
 5 ABW     SP.URB.TOTL 2004  44669
 6 ABW     SP.URB.TOTL 2005  44889
 7 ABW     SP.URB.TOTL 2006  44881
 8 ABW     SP.URB.TOTL 2007  44686
 9 ABW     SP.URB.TOTL 2008  44375
10 ABW     SP.URB.TOTL 2009  44052
# … with 18,998 more rows
#consider the indicator variable
pop2 %>% count(indicator)
# A tibble: 4 x 2
  indicator       n
  <chr>       <int>
1 SP.POP.GROW  4752
2 SP.POP.TOTL  4752
3 SP.URB.GROW  4752
4 SP.URB.TOTL  4752
# split this up into two variables: area (total or urban) and the actual variable (population or growth)
pop3 <- pop2 %>%
separate(indicator, c(NA, "area", "variable"))
pop3
# A tibble: 19,008 x 5
   country area  variable year  value
   <chr>   <chr> <chr>    <chr> <dbl>
 1 ABW     URB   TOTL     2000  42444
 2 ABW     URB   TOTL     2001  43048
 3 ABW     URB   TOTL     2002  43670
 4 ABW     URB   TOTL     2003  44246
 5 ABW     URB   TOTL     2004  44669
 6 ABW     URB   TOTL     2005  44889
 7 ABW     URB   TOTL     2006  44881
 8 ABW     URB   TOTL     2007  44686
 9 ABW     URB   TOTL     2008  44375
10 ABW     URB   TOTL     2009  44052
# … with 18,998 more rows
# complete the tidying by pivoting variable and value to make TOTL and GROW columns
pop3 %>%
pivot_wider(names_from = variable, values_from = value)
# A tibble: 9,504 x 5
   country area  year   TOTL    GROW
   <chr>   <chr> <chr> <dbl>   <dbl>
 1 ABW     URB   2000  42444  1.18
 2 ABW     URB   2001  43048  1.41
 3 ABW     URB   2002  43670  1.43
 4 ABW     URB   2003  44246  1.31
 5 ABW     URB   2004  44669  0.951
 6 ABW     URB   2005  44889  0.491
 7 ABW     URB   2006  44881 -0.0178
 8 ABW     URB   2007  44686 -0.435
 9 ABW     URB   2008  44375 -0.698
10 ABW     URB   2009  44052 -0.731
# … with 9,494 more rows
Multi-choice
How to deal with a common way of recording multiple choice data
# Often you will get such data as follows
multi <- tribble(
  ~id, ~choice1, ~choice2, ~choice3,
  1, "A", "B", "C",
  2, "C", "B",  NA,
  3, "D",  NA,  NA,
  4, "B", "D",  NA
)

# First, make the data longer
multi2 <- multi %>%
  pivot_longer(-id, values_drop_na = TRUE) %>%
  mutate(checked = TRUE)
multi2
# A tibble: 8 x 4
     id name    value checked
  <dbl> <chr>   <chr> <lgl>
1     1 choice1 A     TRUE
2     1 choice2 B     TRUE
3     1 choice3 C     TRUE
4     2 choice1 C     TRUE
5     2 choice2 B     TRUE
6     3 choice1 D     TRUE
7     4 choice1 B     TRUE
8     4 choice2 D     TRUE
# Then make the data wider
multi2 %>%
pivot_wider(
id_cols = id,
names_from = value,
values_from = checked,
values_fill = list(checked = FALSE)
)
# A tibble: 4 x 5
     id A     B     C     D
  <dbl> <lgl> <lgl> <lgl> <lgl>
1     1 TRUE  TRUE  TRUE  FALSE
2     2 FALSE TRUE  TRUE  FALSE
3     3 FALSE FALSE FALSE TRUE
4     4 FALSE TRUE  FALSE TRUE
Now that you know how to use each function, here are 2 concrete examples to help you understand when to use pivot_longer() and when to use pivot_wider().
Examples
pivot_longer()
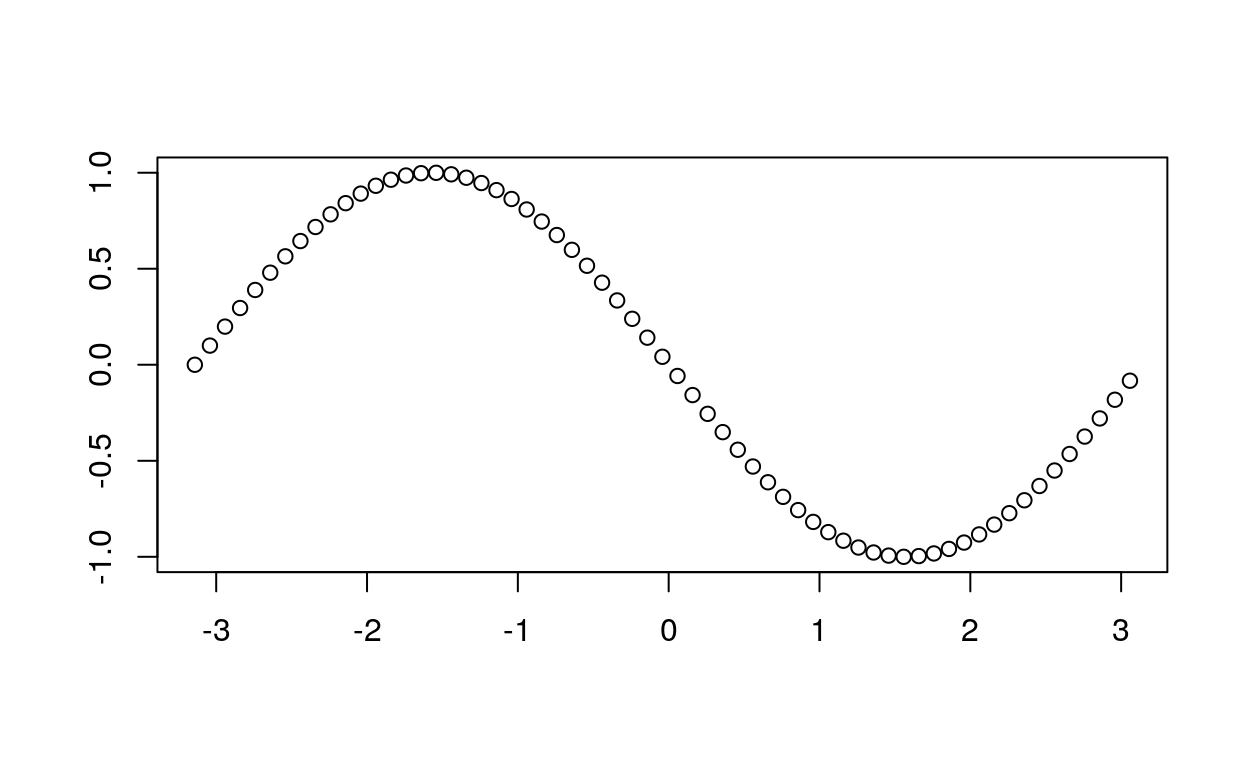
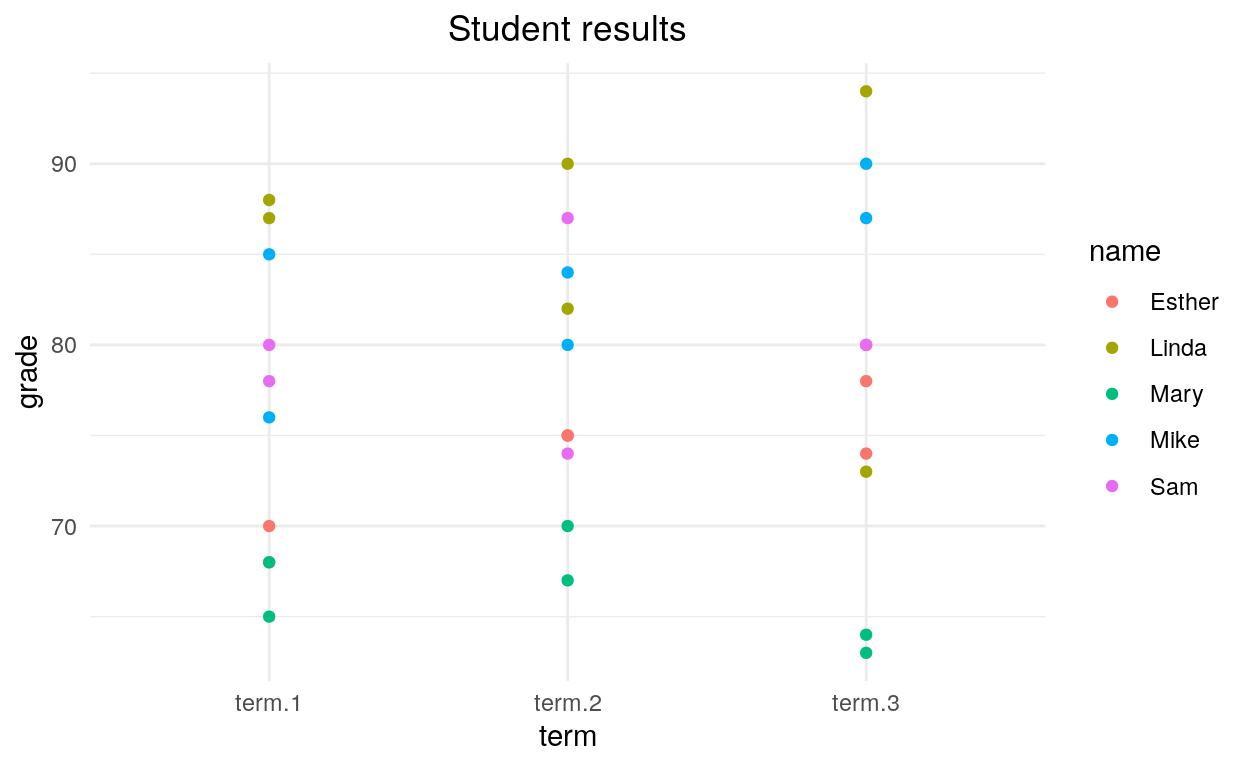
When you want to create a graphic with ggplot2 you need your data to be in the long format
Download the .csv file here
kable(student_results)%>%
  kable_styling() %>%
  scroll_box(width = "500px", height = "200px")
| id | name | phone | sex.and.age | test.number | term.1 | term.2 | term.3 |
|---|---|---|---|---|---|---|---|
| 1 | Mike | 134 | m_12 | test 1 | 76 | 84 | 87 |
| 2 | Linda | 270 | f_13 | test 1 | 88 | 90 | 73 |
| 3 | Sam | 210 | m_11 | test 1 | 78 | 74 | 80 |
| 4 | Esther | 617 | f_12 | test 1 | 68 | 75 | 74 |
| 5 | Mary | 114 | f_14 | test 1 | 65 | 67 | 64 |
| 1 | Mike | 134 | m_12 | test 2 | 85 | 80 | 90 |
| 2 | Linda | 270 | f_13 | test 2 | 87 | 82 | 94 |
| 3 | Sam | 210 | m_11 | test 2 | 80 | 87 | 80 |
| 4 | Esther | 617 | f_12 | test 2 | 70 | 75 | 78 |
| 5 | Mary | 114 | f_14 | test 2 | 68 | 70 | 63 |
student_results <- select(student_results, name, term.1, term.2, term.3)
student_results$name <- as.character(student_results$name)
student_results$term.1 <- as.numeric(student_results$term.1)
student_results$term.2 <- as.numeric(student_results$term.2)
student_results$term.3 <- as.numeric(student_results$term.3)

kable(student_results)%>%
  kable_styling() %>%
  scroll_box(width = "500px", height = "200px")
| name | term.1 | term.2 | term.3 |
|---|---|---|---|
| Mike | 76 | 84 | 87 |
| Linda | 88 | 90 | 73 |
| Sam | 78 | 74 | 80 |
| Esther | 68 | 75 | 74 |
| Mary | 65 | 67 | 64 |
| Mike | 85 | 80 | 90 |
| Linda | 87 | 82 | 94 |
| Sam | 80 | 87 | 80 |
| Esther | 70 | 75 | 78 |
| Mary | 68 | 70 | 63 |
final <- student_results %>%
            pivot_longer(-name, names_to = "term", values_to = "grade")

kable(final)%>%
  kable_styling() %>%
  scroll_box(width = "500px", height = "200px")
| name | term | grade |
|---|---|---|
| Mike | term.1 | 76 |
| Mike | term.2 | 84 |
| Mike | term.3 | 87 |
| Linda | term.1 | 88 |
| Linda | term.2 | 90 |
| Linda | term.3 | 73 |
| Sam | term.1 | 78 |
| Sam | term.2 | 74 |
| Sam | term.3 | 80 |
| Esther | term.1 | 68 |
| Esther | term.2 | 75 |
| Esther | term.3 | 74 |
| Mary | term.1 | 65 |
| Mary | term.2 | 67 |
| Mary | term.3 | 64 |
| Mike | term.1 | 85 |
| Mike | term.2 | 80 |
| Mike | term.3 | 90 |
| Linda | term.1 | 87 |
| Linda | term.2 | 82 |
| Linda | term.3 | 94 |
| Sam | term.1 | 80 |
| Sam | term.2 | 87 |
| Sam | term.3 | 80 |
| Esther | term.1 | 70 |
| Esther | term.2 | 75 |
| Esther | term.3 | 78 |
| Mary | term.1 | 68 |
| Mary | term.2 | 70 |
| Mary | term.3 | 63 |
ggplot(data = final, aes(x = term, y = grade, color = name)) +
  geom_point() +
  theme_minimal() +
  theme(plot.title = element_text(hjust = 0.5)) +
  labs(title = "Student results",
       x = "term",
       y = "grade",
       colour = "name"
       )
pivot_wider()
# Invoke following packages
library(tidyr)
library(dplyr)
library(readr)
library(ggplot2)
library(WDI)
library(kableExtra)

WDIdata <- WDIsearch("emission")
pollution <- WDI(indicator="EN.ATM.CO2E.KT", start = 2000, end = 2007)

# Data Wrangling :

  names(pollution)[names(pollution) == "EN.ATM.CO2E.KT"] <- "pollution_qty" #rename column
  names(pollution)[names(pollution) == "country"] <- "ADMIN" #rename column

  # gsub function to rename ADMIN regions in "pollution" data frame to match "world@data" ADMIN regions

    pollution$ADMIN <- gsub("United States", "United States of America", pollution$ADMIN)
    pollution$ADMIN <- gsub("Russian Federation", "Russia", pollution$ADMIN)
    pollution$ADMIN <- gsub("Egypt, Arab Rep.", "Egypt", pollution$ADMIN)
    pollution$ADMIN <- gsub("Iran, Islamic Rep.", "Iran", pollution$ADMIN)
    pollution$ADMIN <- gsub("Venezuela, RB", "Venezuela", pollution$ADMIN)
    pollution$ADMIN <- gsub("Congo, Rep.", "Republic of the Congo", pollution$ADMIN)
    pollution$ADMIN <- gsub("Congo, Dem. Rep.", "Democratic Republic of the Congo", pollution$ADMIN)
    pollution$ADMIN <- gsub("Yemen, Rep.", "Yemen", pollution$ADMIN)
    pollution$ADMIN <- gsub("Tanzania", "United Republic of Tanzania", pollution$ADMIN)
    pollution$ADMIN <- gsub("Syrian Arab Republic", "Syria", pollution$ADMIN)
    pollution$ADMIN <- gsub("Korea, Dem. People’s Rep.", "North Korea", pollution$ADMIN)
    pollution$ADMIN <- gsub("Korea, Rep.", "South Korea", pollution$ADMIN)
    pollution$ADMIN <- gsub("Kyrgyz Republic", "Kyrgyzstan", pollution$ADMIN)
    pollution$ADMIN <- gsub("Slovak Republic", "Slovakia", pollution$ADMIN)
    pollution$ADMIN <- gsub("Czech Republic", "Czechia", pollution$ADMIN)
    pollution$ADMIN <- gsub("Serbia", "Republic of Serbia", pollution$ADMIN)
    pollution$ADMIN <- gsub("Timor-Leste", "East Timor", pollution$ADMIN)
    pollution$ADMIN <- gsub("Bahamas, The", "The Bahamas", pollution$ADMIN)

kable(pollution)%>%
  kable_styling() %>%
  scroll_box(width = "500px", height = "200px")
| iso2c | ADMIN | pollution_qty | year |
|---|---|---|---|
| 1A | Arab World | 1360284.651 | 2007 |
| 1A | Arab World | 1382459.000 | 2006 |
| 1A | Arab World | 1318939.226 | 2005 |
| 1A | Arab World | 1253266.923 | 2004 |
| 1A | Arab World | 1143443.940 | 2003 |
| 1A | Arab World | 1062296.897 | 2002 |
| 1A | Arab World | 1040811.944 | 2001 |
| 1A | Arab World | 1046627.806 | 2000 |
| S3 | Caribbean small states | 63805.800 | 2007 |
| S3 | Caribbean small states | 62397.672 | 2006 |
| S3 | Caribbean small states | 56842.167 | 2005 |
| S3 | Caribbean small states | 52496.772 | 2004 |
| S3 | Caribbean small states | 50908.961 | 2003 |
| S3 | Caribbean small states | 46926.599 | 2002 |
| S3 | Caribbean small states | 45797.163 | 2001 |
| S3 | Caribbean small states | 42757.220 | 2000 |
| B8 | Central Europe and the Baltics | 766714.695 | 2007 |
| B8 | Central Europe and the Baltics | 767063.060 | 2006 |
| B8 | Central Europe and the Baltics | 741005.358 | 2005 |
| B8 | Central Europe and the Baltics | 737140.340 | 2004 |
| B8 | Central Europe and the Baltics | 747022.905 | 2003 |
| B8 | Central Europe and the Baltics | 723554.105 | 2002 |
| B8 | Central Europe and the Baltics | 735391.181 | 2001 |
| B8 | Central Europe and the Baltics | 716124.763 | 2000 |
| V2 | Early-demographic dividend | 5484214.853 | 2007 |
| V2 | Early-demographic dividend | 5275272.860 | 2006 |
| V2 | Early-demographic dividend | 5002330.716 | 2005 |
| V2 | Early-demographic dividend | 4833667.051 | 2004 |
| V2 | Early-demographic dividend | 4598601.350 | 2003 |
| V2 | Early-demographic dividend | 4370374.604 | 2002 |
| V2 | Early-demographic dividend | 4290070.971 | 2001 |
| V2 | Early-demographic dividend | 4237636.538 | 2000 |
| Z4 | East Asia & Pacific | 10281497.768 | 2007 |
| Z4 | East Asia & Pacific | 10008085.988 | 2006 |
| Z4 | East Asia & Pacific | 9362921.050 | 2005 |
| Z4 | East Asia & Pacific | 8690370.183 | 2004 |
| Z4 | East Asia & Pacific | 7877680.098 | 2003 |
| Z4 | East Asia & Pacific | 7120524.831 | 2002 |
| Z4 | East Asia & Pacific | 6667667.367 | 2001 |
| Z4 | East Asia & Pacific | 6542447.083 | 2000 |
| 4E | East Asia & Pacific (excluding high income) | 7772136.778 | 2007 |
| 4E | East Asia & Pacific (excluding high income) | 7566735.833 | 2006 |
| 4E | East Asia & Pacific (excluding high income) | 6929102.534 | 2005 |
| 4E | East Asia & Pacific (excluding high income) | 6233173.533 | 2004 |
| 4E | East Asia & Pacific (excluding high income) | 5469902.125 | 2003 |
| 4E | East Asia & Pacific (excluding high income) | 4725754.582 | 2002 |
| 4E | East Asia & Pacific (excluding high income) | 4332445.942 | 2001 |
| 4E | East Asia & Pacific (excluding high income) | 4188676.507 | 2000 |
| T4 | East Asia & Pacific (IDA & IBRD countries) | 7708019.332 | 2007 |
| T4 | East Asia & Pacific (IDA & IBRD countries) | 7489924.507 | 2006 |
| T4 | East Asia & Pacific (IDA & IBRD countries) | 6853645.002 | 2005 |
| T4 | East Asia & Pacific (IDA & IBRD countries) | 6160948.702 | 2004 |
| T4 | East Asia & Pacific (IDA & IBRD countries) | 5399298.134 | 2003 |
| T4 | East Asia & Pacific (IDA & IBRD countries) | 4656704.965 | 2002 |
| T4 | East Asia & Pacific (IDA & IBRD countries) | 4260413.212 | 2001 |
| T4 | East Asia & Pacific (IDA & IBRD countries) | 4119206.817 | 2000 |
| XC | Euro area | 2705219.240 | 2007 |
| XC | Euro area | 2752534.541 | 2006 |
| XC | Euro area | 2751595.789 | 2005 |
| XC | Euro area | 2766494.810 | 2004 |
| XC | Euro area | 2741848.903 | 2003 |
| XC | Euro area | 2701643.915 | 2002 |
| XC | Euro area | 2702479.991 | 2001 |
| XC | Euro area | 2637185.389 | 2000 |
| Z7 | Europe & Central Asia | 6985332.291 | 2007 |
| Z7 | Europe & Central Asia | 7015318.803 | 2006 |
| Z7 | Europe & Central Asia | 6879559.032 | 2005 |
| Z7 | Europe & Central Asia | 6875921.212 | 2004 |
| Z7 | Europe & Central Asia | 6832819.904 | 2003 |
| Z7 | Europe & Central Asia | 6640019.149 | 2002 |
| Z7 | Europe & Central Asia | 6652964.745 | 2001 |
| Z7 | Europe & Central Asia | 6569031.596 | 2000 |
| 7E | Europe & Central Asia (excluding high income) | 2941111.747 | 2007 |
| 7E | Europe & Central Asia (excluding high income) | 2896398.725 | 2006 |
| 7E | Europe & Central Asia (excluding high income) | 2792648.497 | 2005 |
| 7E | Europe & Central Asia (excluding high income) | 2772988.495 | 2004 |
| 7E | Europe & Central Asia (excluding high income) | 2736197.872 | 2003 |
| 7E | Europe & Central Asia (excluding high income) | 2620098.254 | 2002 |
| 7E | Europe & Central Asia (excluding high income) | 2604309.368 | 2001 |
| 7E | Europe & Central Asia (excluding high income) | 2609943.155 | 2000 |
| T7 | Europe & Central Asia (IDA & IBRD countries) | 3381468.964 | 2007 |
| T7 | Europe & Central Asia (IDA & IBRD countries) | 3341352.768 | 2006 |
| T7 | Europe & Central Asia (IDA & IBRD countries) | 3214135.479 | 2005 |
| T7 | Europe & Central Asia (IDA & IBRD countries) | 3196694.082 | 2004 |
| T7 | Europe & Central Asia (IDA & IBRD countries) | 3162684.108 | 2003 |
| T7 | Europe & Central Asia (IDA & IBRD countries) | 3033937.682 | 2002 |
| T7 | Europe & Central Asia (IDA & IBRD countries) | 3023070.523 | 2001 |
| T7 | Europe & Central Asia (IDA & IBRD countries) | 3019489.343 | 2000 |
| EU | European Union | 3475446.921 | 2007 |
| EU | European Union | 3530492.258 | 2006 |
| EU | European Union | 3497837.623 | 2005 |
| EU | European Union | 3516330.304 | 2004 |
| EU | European Union | 3507327.819 | 2003 |
| EU | European Union | 3445058.492 | 2002 |
| EU | European Union | 3451952.452 | 2001 |
| EU | European Union | 3370336.033 | 2000 |
| F1 | Fragile and conflict affected situations | 552632.508 | 2007 |
| F1 | Fragile and conflict affected situations | 586257.294 | 2006 |
| F1 | Fragile and conflict affected situations | 596101.985 | 2005 |
| F1 | Fragile and conflict affected situations | 573599.300 | 2004 |
| F1 | Fragile and conflict affected situations | 588448.749 | 2003 |
| F1 | Fragile and conflict affected situations | 556393.569 | 2002 |
| F1 | Fragile and conflict affected situations | 533947.919 | 2001 |
| F1 | Fragile and conflict affected situations | 492324.166 | 2000 |
| XE | Heavily indebted poor countries (HIPC) | 116881.958 | 2007 |
| XE | Heavily indebted poor countries (HIPC) | 109720.307 | 2006 |
| XE | Heavily indebted poor countries (HIPC) | 101183.531 | 2005 |
| XE | Heavily indebted poor countries (HIPC) | 98649.634 | 2004 |
| XE | Heavily indebted poor countries (HIPC) | 91352.304 | 2003 |
| XE | Heavily indebted poor countries (HIPC) | 85928.811 | 2002 |
| XE | Heavily indebted poor countries (HIPC) | 80343.970 | 2001 |
| XE | Heavily indebted poor countries (HIPC) | 77509.379 | 2000 |
| XD | High income | 13875575.807 | 2007 |
| XD | High income | 13800439.207 | 2006 |
| XD | High income | 13760173.545 | 2005 |
| XD | High income | 13726735.810 | 2004 |
| XD | High income | 13510226.570 | 2003 |
| XD | High income | 13310449.059 | 2002 |
| XD | High income | 13223938.705 | 2001 |
| XD | High income | 13262712.366 | 2000 |
| XF | IBRD only | 15419500.312 | 2007 |
| XF | IBRD only | 15023119.614 | 2006 |
| XF | IBRD only | 14075502.916 | 2005 |
| XF | IBRD only | 13179372.201 | 2004 |
| XF | IBRD only | 12204038.125 | 2003 |
| XF | IBRD only | 11160923.825 | 2002 |
| XF | IBRD only | 10726686.282 | 2001 |
| XF | IBRD only | 10516805.477 | 2000 |
| ZT | IDA & IBRD total | 16109569.753 | 2007 |
| ZT | IDA & IBRD total | 15675953.611 | 2006 |
| ZT | IDA & IBRD total | 14706390.230 | 2005 |
| ZT | IDA & IBRD total | 13800606.979 | 2004 |
| ZT | IDA & IBRD total | 12801637.592 | 2003 |
| ZT | IDA & IBRD total | 11725274.143 | 2002 |
| ZT | IDA & IBRD total | 11278829.534 | 2001 |
| ZT | IDA & IBRD total | 11050716.594 | 2000 |
| XH | IDA blend | 409732.245 | 2007 |
| XH | IDA blend | 396743.731 | 2006 |
| XH | IDA blend | 391041.546 | 2005 |
| XH | IDA blend | 385959.084 | 2004 |
| XH | IDA blend | 374811.404 | 2003 |
| XH | IDA blend | 366542.319 | 2002 |
| XH | IDA blend | 350382.070 | 2001 |
| XH | IDA blend | 340876.689 | 2000 |
| XI | IDA only | 276066.837 | 2007 |
| XI | IDA only | 251222.886 | 2006 |
| XI | IDA only | 235184.048 | 2005 |
| XI | IDA only | 231207.792 | 2004 |
| XI | IDA only | 219114.622 | 2003 |
| XI | IDA only | 194102.445 | 2002 |
| XI | IDA only | 198644.553 | 2001 |
| XI | IDA only | 189812.677 | 2000 |
| XG | IDA total | 687626.574 | 2007 |
| XG | IDA total | 650094.046 | 2006 |
| XG | IDA total | 628598.823 | 2005 |
| XG | IDA total | 619529.708 | 2004 |
| XG | IDA total | 596341.035 | 2003 |
| XG | IDA total | 563455.213 | 2002 |
| XG | IDA total | 551425.592 | 2001 |
| XG | IDA total | 533098.835 | 2000 |
| V3 | Late-demographic dividend | 10920929.642 | 2007 |
| V3 | Late-demographic dividend | 10689357.022 | 2006 |
| V3 | Late-demographic dividend | 9898776.613 | 2005 |
| V3 | Late-demographic dividend | 9134528.562 | 2004 |
| V3 | Late-demographic dividend | 8324075.874 | 2003 |
| V3 | Late-demographic dividend | 7478529.180 | 2002 |
| V3 | Late-demographic dividend | 7110925.021 | 2001 |
| V3 | Late-demographic dividend | 6958306.898 | 2000 |
| ZJ | Latin America & Caribbean | 1593209.140 | 2007 |
| ZJ | Latin America & Caribbean | 1567338.855 | 2006 |
| ZJ | Latin America & Caribbean | 1525959.796 | 2005 |
| ZJ | Latin America & Caribbean | 1449822.774 | 2004 |
| ZJ | Latin America & Caribbean | 1440414.044 | 2003 |
| ZJ | Latin America & Caribbean | 1405994.766 | 2002 |
| ZJ | Latin America & Caribbean | 1389105.202 | 2001 |
| ZJ | Latin America & Caribbean | 1357473.558 | 2000 |
| XJ | Latin America & Caribbean (excluding high income) | 1431736.146 | 2007 |
| XJ | Latin America & Caribbean (excluding high income) | 1415337.322 | 2006 |
| XJ | Latin America & Caribbean (excluding high income) | 1383617.772 | 2005 |
| XJ | Latin America & Caribbean (excluding high income) | 1316618.015 | 2004 |
| XJ | Latin America & Caribbean (excluding high income) | 1313743.087 | 2003 |
| XJ | Latin America & Caribbean (excluding high income) | 1284157.731 | 2002 |
| XJ | Latin America & Caribbean (excluding high income) | 1270197.462 | 2001 |
| XJ | Latin America & Caribbean (excluding high income) | 1237073.451 | 2000 |
| T2 | Latin America & the Caribbean (IDA & IBRD countries) | 1536883.704 | 2007 |
| T2 | Latin America & the Caribbean (IDA & IBRD countries) | 1511086.359 | 2006 |
| T2 | Latin America & the Caribbean (IDA & IBRD countries) | 1470822.699 | 2005 |
| T2 | Latin America & the Caribbean (IDA & IBRD countries) | 1396870.310 | 2004 |
| T2 | Latin America & the Caribbean (IDA & IBRD countries) | 1387200.431 | 2003 |
| T2 | Latin America & the Caribbean (IDA & IBRD countries) | 1352910.314 | 2002 |
| T2 | Latin America & the Caribbean (IDA & IBRD countries) | 1337061.540 | 2001 |
| T2 | Latin America & the Caribbean (IDA & IBRD countries) | 1305257.649 | 2000 |
| XL | Least developed countries: UN classification | 183973.865 | 2007 |
| XL | Least developed countries: UN classification | 173509.872 | 2006 |
| XL | Least developed countries: UN classification | 159659.810 | 2005 |
| XL | Least developed countries: UN classification | 154129.481 | 2004 |
| XL | Least developed countries: UN classification | 132944.182 | 2003 |
| XL | Least developed countries: UN classification | 127704.727 | 2002 |
| XL | Least developed countries: UN classification | 120565.420 | 2001 |
| XL | Least developed countries: UN classification | 111279.094 | 2000 |
| XO | Low & middle income | 15626291.388 | 2007 |
| XO | Low & middle income | 15210105.359 | 2006 |
| XO | Low & middle income | 14271909.444 | 2005 |
| XO | Low & middle income | 13367216.613 | 2004 |
| XO | Low & middle income | 12369974.084 | 2003 |
| XO | Low & middle income | 11309493.439 | 2002 |
| XO | Low & middle income | 10863207.885 | 2001 |
| XO | Low & middle income | 10640754.412 | 2000 |
| XM | Low income | 207668.273 | 2007 |
| XM | Low income | 201797.578 | 2006 |
| XM | Low income | 192972.622 | 2005 |
| XM | Low income | 188872.213 | 2004 |
| XM | Low income | 184934.460 | 2003 |
| XM | Low income | 162348.171 | 2002 |
| XM | Low income | 173828.557 | 2001 |
| XM | Low income | 169921.065 | 2000 |
| XN | Lower middle income | 2888209.874 | 2007 |
| XN | Lower middle income | 2738801.626 | 2006 |
| XN | Lower middle income | 2640041.982 | 2005 |
| XN | Lower middle income | 2524293.127 | 2004 |
| XN | Lower middle income | 2425049.439 | 2003 |
| XN | Lower middle income | 2306498.996 | 2002 |
| XN | Lower middle income | 2252498.643 | 2001 |
| XN | Lower middle income | 2237030.155 | 2000 |
| ZQ | Middle East & North Africa | 1928724.656 | 2007 |
| ZQ | Middle East & North Africa | 1942464.905 | 2006 |
| ZQ | Middle East & North Africa | 1834094.054 | 2005 |
| ZQ | Middle East & North Africa | 1748161.576 | 2004 |
| ZQ | Middle East & North Africa | 1616164.244 | 2003 |
| ZQ | Middle East & North Africa | 1516011.140 | 2002 |
| ZQ | Middle East & North Africa | 1497085.753 | 2001 |
| ZQ | Middle East & North Africa | 1473950.650 | 2000 |
| XQ | Middle East & North Africa (excluding high income) | 1130037.388 | 2007 |
| XQ | Middle East & North Africa (excluding high income) | 1124610.228 | 2006 |
| XQ | Middle East & North Africa (excluding high income) | 1088453.608 | 2005 |
| XQ | Middle East & North Africa (excluding high income) | 1025139.186 | 2004 |
| XQ | Middle East & North Africa (excluding high income) | 966001.477 | 2003 |
| XQ | Middle East & North Africa (excluding high income) | 902342.357 | 2002 |
| XQ | Middle East & North Africa (excluding high income) | 898961.383 | 2001 |
| XQ | Middle East & North Africa (excluding high income) | 873277.715 | 2000 |
| T3 | Middle East & North Africa (IDA & IBRD countries) | 1127712.510 | 2007 |
| T3 | Middle East & North Africa (IDA & IBRD countries) | 1122344.022 | 2006 |
| T3 | Middle East & North Africa (IDA & IBRD countries) | 1085710.692 | 2005 |
| T3 | Middle East & North Africa (IDA & IBRD countries) | 1022942.653 | 2004 |
| T3 | Middle East & North Africa (IDA & IBRD countries) | 964721.694 | 2003 |
| T3 | Middle East & North Africa (IDA & IBRD countries) | 901187.252 | 2002 |
| T3 | Middle East & North Africa (IDA & IBRD countries) | 897611.927 | 2001 |
| T3 | Middle East & North Africa (IDA & IBRD countries) | 871616.564 | 2000 |
| XP | Middle income | 15416150.705 | 2007 |
| XP | Middle income | 15005890.983 | 2006 |
| XP | Middle income | 14076763.903 | 2005 |
| XP | Middle income | 13176520.890 | 2004 |
| XP | Middle income | 12183616.422 | 2003 |
| XP | Middle income | 11145668.856 | 2002 |
| XP | Middle income | 10688426.498 | 2001 |
| XP | Middle income | 10469890.979 | 2000 |
| XU | North America | 6361606.942 | 2007 |
| XU | North America | 6269931.942 | 2006 |
| XU | North America | 6351735.378 | 2005 |
| XU | North America | 6310015.919 | 2004 |
| XU | North America | 6229363.921 | 2003 |
| XU | North America | 6161201.725 | 2002 |
| XU | North America | 6124249.366 | 2001 |
| XU | North America | 6228582.850 | 2000 |
| XY | Not classified | NA | 2007 |
| XY | Not classified | NA | 2006 |
| XY | Not classified | NA | 2005 |
| XY | Not classified | NA | 2004 |
| XY | Not classified | NA | 2003 |
| XY | Not classified | NA | 2002 |
| XY | Not classified | NA | 2001 |
| XY | Not classified | NA | 2000 |
| OE | OECD members | 13376456.931 | 2007 |
| OE | OECD members | 13279765.475 | 2006 |
| OE | OECD members | 13272160.117 | 2005 |
| OE | OECD members | 13236868.909 | 2004 |
| OE | OECD members | 13094200.607 | 2003 |
| OE | OECD members | 12892508.273 | 2002 |
| OE | OECD members | 12827254.008 | 2001 |
| OE | OECD members | 12879277.737 | 2000 |
| S4 | Other small states | 162198.729 | 2007 |
| S4 | Other small states | 148805.666 | 2006 |
| S4 | Other small states | 136444.824 | 2005 |
| S4 | Other small states | 124964.308 | 2004 |
| S4 | Other small states | 122123.190 | 2003 |
| S4 | Other small states | 115501.399 | 2002 |
| S4 | Other small states | 113083.562 | 2001 |
| S4 | Other small states | 105560.152 | 2000 |
| S2 | Pacific island small states | 2346.880 | 2007 |
| S2 | Pacific island small states | 2310.210 | 2006 |
| S2 | Pacific island small states | 2178.198 | 2005 |
| S2 | Pacific island small states | 2434.888 | 2004 |
| S2 | Pacific island small states | 2148.862 | 2003 |
| S2 | Pacific island small states | 1976.513 | 2002 |
| S2 | Pacific island small states | 2141.528 | 2001 |
| S2 | Pacific island small states | 1877.504 | 2000 |
| V4 | Post-demographic dividend | 12560523.762 | 2007 |
| V4 | Post-demographic dividend | 12504018.959 | 2006 |
| V4 | Post-demographic dividend | 12563127.332 | 2005 |
| V4 | Post-demographic dividend | 12569936.951 | 2004 |
| V4 | Post-demographic dividend | 12444950.923 | 2003 |
| V4 | Post-demographic dividend | 12270178.036 | 2002 |
| V4 | Post-demographic dividend | 12210578.285 | 2001 |
| V4 | Post-demographic dividend | 12260090.119 | 2000 |
| V1 | Pre-demographic dividend | 274307.801 | 2007 |
| V1 | Pre-demographic dividend | 304832.675 | 2006 |
| V1 | Pre-demographic dividend | 320085.825 | 2005 |
| V1 | Pre-demographic dividend | 309602.535 | 2004 |
| V1 | Pre-demographic dividend | 271176.188 | 2003 |
| V1 | Pre-demographic dividend | 261833.355 | 2002 |
| V1 | Pre-demographic dividend | 246143.203 | 2001 |
| V1 | Pre-demographic dividend | 219227.215 | 2000 |
| S1 | Small states | 228484.751 | 2007 |
| S1 | Small states | 213653.388 | 2006 |
| S1 | Small states | 195592.051 | 2005 |
| S1 | Small states | 180025.387 | 2004 |
| S1 | Small states | 175298.064 | 2003 |
| S1 | Small states | 164495.945 | 2002 |
| S1 | Small states | 161112.727 | 2001 |
| S1 | Small states | 150277.486 | 2000 |
| 8S | South Asia | 1629457.119 | 2007 |
| 8S | South Asia | 1510701.324 | 2006 |
| 8S | South Asia | 1416210.068 | 2005 |
| 8S | South Asia | 1340464.516 | 2004 |
| 8S | South Asia | 1269654.746 | 2003 |
| 8S | South Asia | 1217722.692 | 2002 |
| 8S | South Asia | 1197433.181 | 2001 |
| 8S | South Asia | 1180858.341 | 2000 |
| T5 | South Asia (IDA & IBRD) | 1629457.119 | 2007 |
| T5 | South Asia (IDA & IBRD) | 1510701.324 | 2006 |
| T5 | South Asia (IDA & IBRD) | 1416210.068 | 2005 |
| T5 | South Asia (IDA & IBRD) | 1340464.516 | 2004 |
| T5 | South Asia (IDA & IBRD) | 1269654.746 | 2003 |
| T5 | South Asia (IDA & IBRD) | 1217722.692 | 2002 |
| T5 | South Asia (IDA & IBRD) | 1197433.181 | 2001 |
| T5 | South Asia (IDA & IBRD) | 1180858.341 | 2000 |
| ZG | Sub-Saharan Africa | 724727.764 | 2007 |
| ZG | Sub-Saharan Africa | 699333.858 | 2006 |
| ZG | Sub-Saharan Africa | 666453.953 | 2005 |
| ZG | Sub-Saharan Africa | 687638.371 | 2004 |
| ZG | Sub-Saharan Africa | 626728.541 | 2003 |
| ZG | Sub-Saharan Africa | 573623.106 | 2002 |
| ZG | Sub-Saharan Africa | 576070.310 | 2001 |
| ZG | Sub-Saharan Africa | 568106.716 | 2000 |
| ZF | Sub-Saharan Africa (excluding high income) | 720423.189 | 2007 |
| ZF | Sub-Saharan Africa (excluding high income) | 694993.570 | 2006 |
| ZF | Sub-Saharan Africa (excluding high income) | 662491.939 | 2005 |
| ZF | Sub-Saharan Africa (excluding high income) | 683837.565 | 2004 |
| ZF | Sub-Saharan Africa (excluding high income) | 623140.455 | 2003 |
| ZF | Sub-Saharan Africa (excluding high income) | 570218.855 | 2002 |
| ZF | Sub-Saharan Africa (excluding high income) | 572592.237 | 2001 |
| ZF | Sub-Saharan Africa (excluding high income) | 564864.861 | 2000 |
| T6 | Sub-Saharan Africa (IDA & IBRD countries) | 724727.764 | 2007 |
| T6 | Sub-Saharan Africa (IDA & IBRD countries) | 699333.858 | 2006 |
| T6 | Sub-Saharan Africa (IDA & IBRD countries) | 666453.953 | 2005 |
| T6 | Sub-Saharan Africa (IDA & IBRD countries) | 687638.371 | 2004 |
| T6 | Sub-Saharan Africa (IDA & IBRD countries) | 626728.541 | 2003 |
| T6 | Sub-Saharan Africa (IDA & IBRD countries) | 573623.106 | 2002 |
| T6 | Sub-Saharan Africa (IDA & IBRD countries) | 576070.310 | 2001 |
| T6 | Sub-Saharan Africa (IDA & IBRD countries) | 568106.716 | 2000 |
| XT | Upper middle income | 12527912.269 | 2007 |
| XT | Upper middle income | 12267101.983 | 2006 |
| XT | Upper middle income | 11436339.592 | 2005 |
| XT | Upper middle income | 10651564.747 | 2004 |
| XT | Upper middle income | 9757431.042 | 2003 |
| XT | Upper middle income | 8837624.633 | 2002 |
| XT | Upper middle income | 8434215.393 | 2001 |
| XT | Upper middle income | 8231009.725 | 2000 |
| 1W | World | 31033.821 | 2007 |
| 1W | World | 30513.107 | 2006 |
| 1W | World | 29508.349 | 2005 |
| 1W | World | 28356.911 | 2004 |
| 1W | World | 27113.798 | 2003 |
| 1W | World | 25694.669 | 2002 |
| 1W | World | 25085.947 | 2001 |
| 1W | World | 24935.600 | 2000 |
| AF | Afghanistan | 2273.540 | 2007 |
| AF | Afghanistan | 1650.150 | 2006 |
| AF | Afghanistan | 1327.454 | 2005 |
| AF | Afghanistan | 916.750 | 2004 |
| AF | Afghanistan | 1213.777 | 2003 |
| AF | Afghanistan | 1070.764 | 2002 |
| AF | Afghanistan | 817.741 | 2001 |
| AF | Afghanistan | 773.737 | 2000 |
| AL | Albania | 3927.357 | 2007 |
| AL | Albania | 3898.021 | 2006 |
| AL | Albania | 4253.720 | 2005 |
| AL | Albania | 4165.712 | 2004 |
| AL | Albania | 4294.057 | 2003 |
| AL | Albania | 3751.341 | 2002 |
| AL | Albania | 3223.293 | 2001 |
| AL | Albania | 3021.608 | 2000 |
| DZ | Algeria | 109404.945 | 2007 |
| DZ | Algeria | 101069.854 | 2006 |
| DZ | Algeria | 107278.085 | 2005 |
| DZ | Algeria | 88510.379 | 2004 |
| DZ | Algeria | 91575.991 | 2003 |
| DZ | Algeria | 89907.506 | 2002 |
| DZ | Algeria | 84219.989 | 2001 |
| DZ | Algeria | 87861.320 | 2000 |
| AS | American Samoa | NA | 2007 |
| AS | American Samoa | NA | 2006 |
| AS | American Samoa | NA | 2005 |
| AS | American Samoa | NA | 2004 |
| AS | American Samoa | NA | 2003 |
| AS | American Samoa | NA | 2002 |
| AS | American Samoa | NA | 2001 |
| AS | American Samoa | NA | 2000 |
| AD | Andorra | 539.049 | 2007 |
| AD | Andorra | 546.383 | 2006 |
| AD | Andorra | 575.719 | 2005 |
| AD | Andorra | 561.051 | 2004 |
| AD | Andorra | 535.382 | 2003 |
| AD | Andorra | 531.715 | 2002 |
| AD | Andorra | 524.381 | 2001 |
| AD | Andorra | 524.381 | 2000 |
| AO | Angola | 25151.953 | 2007 |
| AO | Angola | 22266.024 | 2006 |
| AO | Angola | 19156.408 | 2005 |
| AO | Angola | 18793.375 | 2004 |
| AO | Angola | 9064.824 | 2003 |
| AO | Angola | 12665.818 | 2002 |
| AO | Angola | 9732.218 | 2001 |
| AO | Angola | 9541.534 | 2000 |
| AG | Antigua and Barbuda | 469.376 | 2007 |
| AG | Antigua and Barbuda | 443.707 | 2006 |
| AG | Antigua and Barbuda | 429.039 | 2005 |
| AG | Antigua and Barbuda | 421.705 | 2004 |
| AG | Antigua and Barbuda | 403.370 | 2003 |
| AG | Antigua and Barbuda | 370.367 | 2002 |
| AG | Antigua and Barbuda | 348.365 | 2001 |
| AG | Antigua and Barbuda | 344.698 | 2000 |
| AR | Argentina | 175176.257 | 2007 |
| AR | Argentina | 175436.614 | 2006 |
| AR | Argentina | 162110.736 | 2005 |
| AR | Argentina | 157589.325 | 2004 |
| AR | Argentina | 135062.944 | 2003 |
| AR | Argentina | 124714.670 | 2002 |
| AR | Argentina | 133720.822 | 2001 |
| AR | Argentina | 142136.587 | 2000 |
| AM | Armenia | 5056.793 | 2007 |
| AM | Armenia | 4378.398 | 2006 |
| AM | Armenia | 4349.062 | 2005 |
| AM | Armenia | 3644.998 | 2004 |
| AM | Armenia | 3428.645 | 2003 |
| AM | Armenia | 3043.610 | 2002 |
| AM | Armenia | 3542.322 | 2001 |
| AM | Armenia | 3465.315 | 2000 |
| AW | Aruba | 2823.590 | 2007 |
| AW | Aruba | 2717.247 | 2006 |
| AW | Aruba | 2720.914 | 2005 |
| AW | Aruba | 2618.238 | 2004 |
| AW | Aruba | 2563.233 | 2003 |
| AW | Aruba | 2438.555 | 2002 |
| AW | Aruba | 2409.219 | 2001 |
| AW | Aruba | 2379.883 | 2000 |
| AU | Australia | 372090.490 | 2007 |
| AU | Australia | 365346.877 | 2006 |
| AU | Australia | 350172.831 | 2005 |
| AU | Australia | 342699.485 | 2004 |
| AU | Australia | 336271.234 | 2003 |
| AU | Australia | 341353.696 | 2002 |
| AU | Australia | 324844.862 | 2001 |
| AU | Australia | 329443.280 | 2000 |
| AT | Austria | 69419.977 | 2007 |
| AT | Austria | 71818.195 | 2006 |
| AT | Austria | 73816.710 | 2005 |
| AT | Austria | 72140.891 | 2004 |
| AT | Austria | 71854.865 | 2003 |
| AT | Austria | 67010.758 | 2002 |
| AT | Austria | 65877.655 | 2001 |
| AT | Austria | 62265.660 | 2000 |
| AZ | Azerbaijan | 30509.440 | 2007 |
| AZ | Azerbaijan | 39167.227 | 2006 |
| AZ | Azerbaijan | 34337.788 | 2005 |
| AZ | Azerbaijan | 32089.917 | 2004 |
| AZ | Azerbaijan | 30615.783 | 2003 |
| AZ | Azerbaijan | 29614.692 | 2002 |
| AZ | Azerbaijan | 28771.282 | 2001 |
| AZ | Azerbaijan | 29508.349 | 2000 |
| BS | The Bahamas | 1796.830 | 2007 |
| BS | The Bahamas | 1778.495 | 2006 |
| BS | The Bahamas | 1829.833 | 2005 |
| BS | The Bahamas | 1972.846 | 2004 |
| BS | The Bahamas | 1965.512 | 2003 |
| BS | The Bahamas | 1928.842 | 2002 |
| BS | The Bahamas | 1870.170 | 2001 |
| BS | The Bahamas | 1950.844 | 2000 |
| BH | Bahrain | 26846.107 | 2007 |
| BH | Bahrain | 19493.772 | 2006 |
| BH | Bahrain | 19878.807 | 2005 |
| BH | Bahrain | 17953.632 | 2004 |
| BH | Bahrain | 16802.194 | 2003 |
| BH | Bahrain | 15889.111 | 2002 |
| BH | Bahrain | 14099.615 | 2001 |
| BH | Bahrain | 18819.044 | 2000 |
| BD | Bangladesh | 44539.382 | 2007 |
| BD | Bangladesh | 43567.627 | 2006 |
| BD | Bangladesh | 39500.924 | 2005 |
| BD | Bangladesh | 37682.092 | 2004 |
| BD | Bangladesh | 35144.528 | 2003 |
| BD | Bangladesh | 33615.389 | 2002 |
| BD | Bangladesh | 32621.632 | 2001 |
| BD | Bangladesh | 27627.178 | 2000 |
| BB | Barbados | 1360.457 | 2007 |
| BB | Barbados | 1360.457 | 2006 |
| BB | Barbados | 1334.788 | 2005 |
| BB | Barbados | 1279.783 | 2004 |
| BB | Barbados | 1254.114 | 2003 |
| BB | Barbados | 1202.776 | 2002 |
| BB | Barbados | 1188.108 | 2001 |
| BB | Barbados | 1151.438 | 2000 |
| BY | Belarus | 60523.835 | 2007 |
| BY | Belarus | 62071.309 | 2006 |
| BY | Belarus | 59167.045 | 2005 |
| BY | Belarus | 58158.620 | 2004 |
| BY | Belarus | 53530.866 | 2003 |
| BY | Belarus | 52405.097 | 2002 |
| BY | Belarus | 52760.796 | 2001 |
| BY | Belarus | 53787.556 | 2000 |
| BE | Belgium | 103658.756 | 2007 |
| BE | Belgium | 107204.745 | 2006 |
| BE | Belgium | 108543.200 | 2005 |
| BE | Belgium | 111102.766 | 2004 |
| BE | Belgium | 112914.264 | 2003 |
| BE | Belgium | 107311.088 | 2002 |
| BE | Belgium | 114527.744 | 2001 |
| BE | Belgium | 115118.131 | 2000 |
| BZ | Belize | 476.710 | 2007 |
| BZ | Belize | 443.707 | 2006 |
| BZ | Belize | 421.705 | 2005 |
| BZ | Belize | 392.369 | 2004 |
| BZ | Belize | 432.706 | 2003 |
| BZ | Belize | 432.706 | 2002 |
| BZ | Belize | 447.374 | 2001 |
| BZ | Belize | 396.036 | 2000 |
| BJ | Benin | 4495.742 | 2007 |
| BJ | Benin | 3872.352 | 2006 |
| BJ | Benin | 2394.551 | 2005 |
| BJ | Benin | 2508.228 | 2004 |
| BJ | Benin | 2354.214 | 2003 |
| BJ | Benin | 2079.189 | 2002 |
| BJ | Benin | 1815.165 | 2001 |
| BJ | Benin | 1598.812 | 2000 |
| BM | Bermuda | 729.733 | 2007 |
| BM | Bermuda | 652.726 | 2006 |
| BM | Bermuda | 583.053 | 2005 |
| BM | Bermuda | 583.053 | 2004 |
| BM | Bermuda | 561.051 | 2003 |
| BM | Bermuda | 557.384 | 2002 |
| BM | Bermuda | 528.048 | 2001 |
| BM | Bermuda | 517.047 | 2000 |
| BT | Bhutan | 392.369 | 2007 |
| BT | Bhutan | 392.369 | 2006 |
| BT | Bhutan | 396.036 | 2005 |
| BT | Bhutan | 308.028 | 2004 |
| BT | Bhutan | 377.701 | 2003 |
| BT | Bhutan | 418.038 | 2002 |
| BT | Bhutan | 385.035 | 2001 |
| BT | Bhutan | 396.036 | 2000 |
| BO | Bolivia | 12332.121 | 2007 |
| BO | Bolivia | 15056.702 | 2006 |
| BO | Bolivia | 12185.441 | 2005 |
| BO | Bolivia | 11114.677 | 2004 |
| BO | Bolivia | 11092.675 | 2003 |
| BO | Bolivia | 10395.945 | 2002 |
| BO | Bolivia | 8621.117 | 2001 |
| BO | Bolivia | 11067.006 | 2000 |
| BA | Bosnia and Herzegovina | 17652.938 | 2007 |
| BA | Bosnia and Herzegovina | 17564.930 | 2006 |
| BA | Bosnia and Herzegovina | 16204.473 | 2005 |
| BA | Bosnia and Herzegovina | 15610.419 | 2004 |
| BA | Bosnia and Herzegovina | 14488.317 | 2003 |
| BA | Bosnia and Herzegovina | 14301.300 | 2002 |
| BA | Bosnia and Herzegovina | 13362.548 | 2001 |
| BA | Bosnia and Herzegovina | 13787.920 | 2000 |
| BW | Botswana | 4231.718 | 2007 |
| BW | Botswana | 4136.376 | 2006 |
| BW | Botswana | 4096.039 | 2005 |
| BW | Botswana | 3898.021 | 2004 |
| BW | Botswana | 3828.348 | 2003 |
| BW | Botswana | 3978.695 | 2002 |
| BW | Botswana | 3850.350 | 2001 |
| BW | Botswana | 3780.677 | 2000 |
| BR | Brazil | 363212.683 | 2007 |
| BR | Brazil | 347668.270 | 2006 |
| BR | Brazil | 347308.904 | 2005 |
| BR | Brazil | 337826.042 | 2004 |
| BR | Brazil | 321621.569 | 2003 |
| BR | Brazil | 332266.870 | 2002 |
| BR | Brazil | 337433.673 | 2001 |
| BR | Brazil | 327983.814 | 2000 |
| VG | British Virgin Islands | 187.017 | 2007 |
| VG | British Virgin Islands | 183.350 | 2006 |
| VG | British Virgin Islands | 179.683 | 2005 |
| VG | British Virgin Islands | 161.348 | 2004 |
| VG | British Virgin Islands | 146.680 | 2003 |
| VG | British Virgin Islands | 135.679 | 2002 |
| VG | British Virgin Islands | 128.345 | 2001 |
| VG | British Virgin Islands | 124.678 | 2000 |
| BN | Brunei Darussalam | 8415.765 | 2007 |
| BN | Brunei Darussalam | 4862.442 | 2006 |
| BN | Brunei Darussalam | 5005.455 | 2005 |
| BN | Brunei Darussalam | 4998.121 | 2004 |
| BN | Brunei Darussalam | 4591.084 | 2003 |
| BN | Brunei Darussalam | 4378.398 | 2002 |
| BN | Brunei Darussalam | 4506.743 | 2001 |
| BN | Brunei Darussalam | 4712.095 | 2000 |
| BG | Bulgaria | 52254.750 | 2007 |
| BG | Bulgaria | 48991.120 | 2006 |
| BG | Bulgaria | 47916.689 | 2005 |
| BG | Bulgaria | 46801.921 | 2004 |
| BG | Bulgaria | 47307.967 | 2003 |
| BG | Bulgaria | 44634.724 | 2002 |
| BG | Bulgaria | 46453.556 | 2001 |
| BG | Bulgaria | 43530.957 | 2000 |
| BF | Burkina Faso | 1595.145 | 2007 |
| BF | Burkina Faso | 1360.457 | 2006 |
| BF | Burkina Faso | 1125.769 | 2005 |
| BF | Burkina Faso | 1103.767 | 2004 |
| BF | Burkina Faso | 1078.098 | 2003 |
| BF | Burkina Faso | 1004.758 | 2002 |
| BF | Burkina Faso | 997.424 | 2001 |
| BF | Burkina Faso | 1041.428 | 2000 |
| BI | Burundi | 187.017 | 2007 |
| BI | Burundi | 187.017 | 2006 |
| BI | Burundi | 154.014 | 2005 |
| BI | Burundi | 198.018 | 2004 |
| BI | Burundi | 161.348 | 2003 |
| BI | Burundi | 212.686 | 2002 |
| BI | Burundi | 205.352 | 2001 |
| BI | Burundi | 271.358 | 2000 |
| CV | Cabo Verde | 506.046 | 2007 |
| CV | Cabo Verde | 473.043 | 2006 |
| CV | Cabo Verde | 440.040 | 2005 |
| CV | Cabo Verde | 330.030 | 2004 |
| CV | Cabo Verde | 308.028 | 2003 |
| CV | Cabo Verde | 275.025 | 2002 |
| CV | Cabo Verde | 234.688 | 2001 |
| CV | Cabo Verde | 216.353 | 2000 |
| KH | Cambodia | 3465.315 | 2007 |
| KH | Cambodia | 2999.606 | 2006 |
| KH | Cambodia | 2775.919 | 2005 |
| KH | Cambodia | 2445.889 | 2004 |
| KH | Cambodia | 2379.883 | 2003 |
| KH | Cambodia | 2207.534 | 2002 |
| KH | Cambodia | 2251.538 | 2001 |
| KH | Cambodia | 1976.513 | 2000 |
| CM | Cameroon | 5834.197 | 2007 |
| CM | Cameroon | 3861.351 | 2006 |
| CM | Cameroon | 3696.336 | 2005 |
| CM | Cameroon | 3956.693 | 2004 |
| CM | Cameroon | 3795.345 | 2003 |
| CM | Cameroon | 3417.644 | 2002 |
| CM | Cameroon | 3421.311 | 2001 |
| CM | Cameroon | 3432.312 | 2000 |
| CA | Canada | 571846.648 | 2007 |
| CA | Canada | 571993.328 | 2006 |
| CA | Canada | 561425.034 | 2005 |
| CA | Canada | 553357.634 | 2004 |
| CA | Canada | 553100.944 | 2003 |
| CA | Canada | 519335.208 | 2002 |
| CA | Canada | 527926.989 | 2001 |
| CA | Canada | 534380.909 | 2000 |
| KY | Cayman Islands | 572.052 | 2007 |
| KY | Cayman Islands | 484.044 | 2006 |
| KY | Cayman Islands | 473.043 | 2005 |
| KY | Cayman Islands | 462.042 | 2004 |
| KY | Cayman Islands | 484.044 | 2003 |
| KY | Cayman Islands | 484.044 | 2002 |
| KY | Cayman Islands | 465.709 | 2001 |
| KY | Cayman Islands | 465.709 | 2000 |
| CF | Central African Republic | 253.023 | 2007 |
| CF | Central African Republic | 249.356 | 2006 |
| CF | Central African Republic | 234.688 | 2005 |
| CF | Central African Republic | 234.688 | 2004 |
| CF | Central African Republic | 234.688 | 2003 |
| CF | Central African Republic | 245.689 | 2002 |
| CF | Central African Republic | 245.689 | 2001 |
| CF | Central African Republic | 267.691 | 2000 |
| TD | Chad | 854.411 | 2007 |
| TD | Chad | 792.072 | 2006 |
| TD | Chad | 766.403 | 2005 |
| TD | Chad | 748.068 | 2004 |
| TD | Chad | 744.401 | 2003 |
| TD | Chad | 509.713 | 2002 |
| TD | Chad | 502.379 | 2001 |
| TD | Chad | 487.711 | 2000 |
| JG | Channel Islands | NA | 2007 |
| JG | Channel Islands | NA | 2006 |
| JG | Channel Islands | NA | 2005 |
| JG | Channel Islands | NA | 2004 |
| JG | Channel Islands | NA | 2003 |
| JG | Channel Islands | NA | 2002 |
| JG | Channel Islands | NA | 2001 |
| JG | Channel Islands | NA | 2000 |
| CL | Chile | 71638.512 | 2007 |
| CL | Chile | 64814.225 | 2006 |
| CL | Chile | 61818.286 | 2005 |
| CL | Chile | 59775.767 | 2004 |
| CL | Chile | 55602.721 | 2003 |
| CL | Chile | 55162.681 | 2002 |
| CL | Chile | 53340.182 | 2001 |
| CL | Chile | 58815.013 | 2000 |
| CN | China | 6697654.489 | 2007 |
| CN | China | 6529291.518 | 2006 |
| CN | China | 5896957.705 | 2005 |
| CN | China | 5233538.733 | 2004 |
| CN | China | 4540417.061 | 2003 |
| CN | China | 3850269.326 | 2002 |
| CN | China | 3487566.356 | 2001 |
| CN | China | 3405179.867 | 2000 |
| CO | Colombia | 62430.675 | 2007 |
| CO | Colombia | 62940.388 | 2006 |
| CO | Colombia | 60945.540 | 2005 |
| CO | Colombia | 55071.006 | 2004 |
| CO | Colombia | 57421.553 | 2003 |
| CO | Colombia | 55661.393 | 2002 |
| CO | Colombia | 56273.782 | 2001 |
| CO | Colombia | 57923.932 | 2000 |
| KM | Comoros | 102.676 | 2007 |
| KM | Comoros | 161.348 | 2006 |
| KM | Comoros | 139.346 | 2005 |
| KM | Comoros | 143.013 | 2004 |
| KM | Comoros | 132.012 | 2003 |
| KM | Comoros | 102.676 | 2002 |
| KM | Comoros | 102.676 | 2001 |
| KM | Comoros | 102.676 | 2000 |
| CD | Democratic Republic of the Congo | 1756.493 | 2007 |
| CD | Democratic Republic of the Congo | 1609.813 | 2006 |
| CD | Democratic Republic of the Congo | 1499.803 | 2005 |
| CD | Democratic Republic of the Congo | 1191.775 | 2004 |
| CD | Democratic Republic of the Congo | 1070.764 | 2003 |
| CD | Democratic Republic of the Congo | 876.413 | 2002 |
| CD | Democratic Republic of the Congo | 788.405 | 2001 |
| CD | Democratic Republic of the Congo | 909.416 | 2000 |
| CG | Republic of the Congo | 1213.777 | 2007 |
| CG | Republic of the Congo | 1118.435 | 2006 |
| CG | Republic of the Congo | 982.756 | 2005 |
| CG | Republic of the Congo | 949.753 | 2004 |
| CG | Republic of the Congo | 916.750 | 2003 |
| CG | Republic of the Congo | 575.719 | 2002 |
| CG | Republic of the Congo | 766.403 | 2001 |
| CG | Republic of the Congo | 1048.762 | 2000 |
| CR | Costa Rica | 8122.405 | 2007 |
| CR | Costa Rica | 7099.312 | 2006 |
| CR | Costa Rica | 6868.291 | 2005 |
| CR | Costa Rica | 6930.630 | 2004 |
| CR | Costa Rica | 6626.269 | 2003 |
| CR | Costa Rica | 6325.575 | 2002 |
| CR | Costa Rica | 5760.857 | 2001 |
| CR | Costa Rica | 5474.831 | 2000 |
| CI | Cote d’Ivoire | 6776.616 | 2007 |
| CI | Cote d’Ivoire | 6996.636 | 2006 |
| CI | Cote d’Ivoire | 7825.378 | 2005 |
| CI | Cote d’Ivoire | 7664.030 | 2004 |
| CI | Cote d’Ivoire | 5460.163 | 2003 |
| CI | Cote d’Ivoire | 7286.329 | 2002 |
| CI | Cote d’Ivoire | 7726.369 | 2001 |
| CI | Cote d’Ivoire | 6791.284 | 2000 |
| HR | Croatia | 23828.166 | 2007 |
| HR | Croatia | 22607.055 | 2006 |
| HR | Croatia | 22592.387 | 2005 |
| HR | Croatia | 22376.034 | 2004 |
| HR | Croatia | 22984.756 | 2003 |
| HR | Croatia | 21473.952 | 2002 |
| HR | Croatia | 20395.854 | 2001 |
| HR | Croatia | 19339.758 | 2000 |
| CU | Cuba | 25958.693 | 2007 |
| CU | Cuba | 26505.076 | 2006 |
| CU | Cuba | 26006.364 | 2005 |
| CU | Cuba | 25005.273 | 2004 |
| CU | Cuba | 25485.650 | 2003 |
| CU | Cuba | 26090.705 | 2002 |
| CU | Cuba | 25452.647 | 2001 |
| CU | Cuba | 26083.371 | 2000 |
| CW | Curacao | NA | 2007 |
| CW | Curacao | NA | 2006 |
| CW | Curacao | NA | 2005 |
| CW | Curacao | NA | 2004 |
| CW | Curacao | NA | 2003 |
| CW | Curacao | NA | 2002 |
| CW | Curacao | NA | 2001 |
| CW | Curacao | NA | 2000 |
| CY | Cyprus | 8195.745 | 2007 |
| CY | Cyprus | 7788.708 | 2006 |
| CY | Cyprus | 7502.682 | 2005 |
| CY | Cyprus | 7334.000 | 2004 |
| CY | Cyprus | 7748.371 | 2003 |
| CY | Cyprus | 7022.305 | 2002 |
| CY | Cyprus | 6882.959 | 2001 |
| CY | Cyprus | 6978.301 | 2000 |
| CZ | Czechia | 123288.207 | 2007 |
| CZ | Czechia | 122092.765 | 2006 |
| CZ | Czechia | 120094.250 | 2005 |
| CZ | Czechia | 116757.280 | 2004 |
| CZ | Czechia | 122037.760 | 2003 |
| CZ | Czechia | 119694.547 | 2002 |
| CZ | Czechia | 123684.243 | 2001 |
| CZ | Czechia | 123801.587 | 2000 |
| DK | Denmark | 50318.574 | 2007 |
| DK | Denmark | 55019.668 | 2006 |
| DK | Denmark | 47062.278 | 2005 |
| DK | Denmark | 50600.933 | 2004 |
| DK | Denmark | 55998.757 | 2003 |
| DK | Denmark | 52049.398 | 2002 |
| DK | Denmark | 52918.477 | 2001 |
| DK | Denmark | 51330.666 | 2000 |
| DJ | Djibouti | 462.042 | 2007 |
| DJ | Djibouti | 410.704 | 2006 |
| DJ | Djibouti | 414.371 | 2005 |
| DJ | Djibouti | 407.037 | 2004 |
| DJ | Djibouti | 421.705 | 2003 |
| DJ | Djibouti | 399.703 | 2002 |
| DJ | Djibouti | 366.700 | 2001 |
| DJ | Djibouti | 366.700 | 2000 |
| DM | Dominica | 183.350 | 2007 |
| DM | Dominica | 143.013 | 2006 |
| DM | Dominica | 143.013 | 2005 |
| DM | Dominica | 143.013 | 2004 |
| DM | Dominica | 117.344 | 2003 |
| DM | Dominica | 102.676 | 2002 |
| DM | Dominica | 110.010 | 2001 |
| DM | Dominica | 102.676 | 2000 |
| DO | Dominican Republic | 21173.258 | 2007 |
| DO | Dominican Republic | 19783.465 | 2006 |
| DO | Dominican Republic | 18639.361 | 2005 |
| DO | Dominican Republic | 18309.331 | 2004 |
| DO | Dominican Republic | 21514.289 | 2003 |
| DO | Dominican Republic | 21330.939 | 2002 |
| DO | Dominican Republic | 19816.468 | 2001 |
| DO | Dominican Republic | 19790.799 | 2000 |
| EC | Ecuador | 31924.902 | 2007 |
| EC | Ecuador | 28859.290 | 2006 |
| EC | Ecuador | 30263.751 | 2005 |
| EC | Ecuador | 29046.307 | 2004 |
| EC | Ecuador | 26967.118 | 2003 |
| EC | Ecuador | 24950.268 | 2002 |
| EC | Ecuador | 23116.768 | 2001 |
| EC | Ecuador | 20718.550 | 2000 |
| EG | Egypt | 189092.522 | 2007 |
| EG | Egypt | 178586.567 | 2006 |
| EG | Egypt | 167207.866 | 2005 |
| EG | Egypt | 150911.718 | 2004 |
| EG | Egypt | 147963.450 | 2003 |
| EG | Egypt | 127193.562 | 2002 |
| EG | Egypt | 125451.737 | 2001 |
| EG | Egypt | 141326.180 | 2000 |
| SV | El Salvador | 6978.301 | 2007 |
| SV | El Salvador | 6842.622 | 2006 |
| SV | El Salvador | 6402.582 | 2005 |
| SV | El Salvador | 6365.912 | 2004 |
| SV | El Salvador | 6552.929 | 2003 |
| SV | El Salvador | 6182.562 | 2002 |
| SV | El Salvador | 5951.541 | 2001 |
| SV | El Salvador | 5753.523 | 2000 |
| GQ | Equatorial Guinea | 7865.715 | 2007 |
| GQ | Equatorial Guinea | 8181.077 | 2006 |
| GQ | Equatorial Guinea | 7532.018 | 2005 |
| GQ | Equatorial Guinea | 7058.975 | 2004 |
| GQ | Equatorial Guinea | 7693.366 | 2003 |
| GQ | Equatorial Guinea | 6354.911 | 2002 |
| GQ | Equatorial Guinea | 4334.394 | 2001 |
| GQ | Equatorial Guinea | 458.375 | 2000 |
| ER | Eritrea | 564.718 | 2007 |
| ER | Eritrea | 550.050 | 2006 |
| ER | Eritrea | 766.403 | 2005 |
| ER | Eritrea | 770.070 | 2004 |
| ER | Eritrea | 715.065 | 2003 |
| ER | Eritrea | 605.055 | 2002 |
| ER | Eritrea | 630.724 | 2001 |
| ER | Eritrea | 608.722 | 2000 |
| EE | Estonia | 18357.002 | 2007 |
| EE | Estonia | 16175.137 | 2006 |
| EE | Estonia | 16754.523 | 2005 |
| EE | Estonia | 17282.571 | 2004 |
| EE | Estonia | 17124.890 | 2003 |
| EE | Estonia | 14888.020 | 2002 |
| EE | Estonia | 15570.082 | 2001 |
| EE | Estonia | 14858.684 | 2000 |
| SZ | Eswatini | 1078.098 | 2007 |
| SZ | Eswatini | 1030.427 | 2006 |
| SZ | Eswatini | 1030.427 | 2005 |
| SZ | Eswatini | 1041.428 | 2004 |
| SZ | Eswatini | 1048.762 | 2003 |
| SZ | Eswatini | 1133.103 | 2002 |
| SZ | Eswatini | 1147.771 | 2001 |
| SZ | Eswatini | 1191.775 | 2000 |
| ET | Ethiopia | 6024.881 | 2007 |
| ET | Ethiopia | 5504.167 | 2006 |
| ET | Ethiopia | 5119.132 | 2005 |
| ET | Ethiopia | 5295.148 | 2004 |
| ET | Ethiopia | 4987.120 | 2003 |
| ET | Ethiopia | 4521.411 | 2002 |
| ET | Ethiopia | 4352.729 | 2001 |
| ET | Ethiopia | 3549.656 | 2000 |
| FO | Faroe Islands | 689.396 | 2007 |
| FO | Faroe Islands | 678.395 | 2006 |
| FO | Faroe Islands | 722.399 | 2005 |
| FO | Faroe Islands | 748.068 | 2004 |
| FO | Faroe Islands | 733.400 | 2003 |
| FO | Faroe Islands | 726.066 | 2002 |
| FO | Faroe Islands | 762.736 | 2001 |
| FO | Faroe Islands | 689.396 | 2000 |
| FJ | Fiji | 1158.772 | 2007 |
| FJ | Fiji | 1217.444 | 2006 |
| FJ | Fiji | 1096.433 | 2005 |
| FJ | Fiji | 1353.123 | 2004 |
| FJ | Fiji | 1048.762 | 2003 |
| FJ | Fiji | 891.081 | 2002 |
| FJ | Fiji | 1056.096 | 2001 |
| FJ | Fiji | 843.410 | 2000 |
| FI | Finland | 63739.794 | 2007 |
| FI | Finland | 65774.979 | 2006 |
| FI | Finland | 54777.646 | 2005 |
| FI | Finland | 67186.774 | 2004 |
| FI | Finland | 68671.909 | 2003 |
| FI | Finland | 61348.910 | 2002 |
| FI | Finland | 56552.474 | 2001 |
| FI | Finland | 52196.078 | 2000 |
| FR | France | 369142.222 | 2007 |
| FR | France | 375764.824 | 2006 |
| FR | France | 385368.697 | 2005 |
| FR | France | 383758.884 | 2004 |
| FR | France | 380689.605 | 2003 |
| FR | France | 375075.428 | 2002 |
| FR | France | 377535.985 | 2001 |
| FR | France | 362226.260 | 2000 |
| PF | French Polynesia | 766.403 | 2007 |
| PF | French Polynesia | 781.071 | 2006 |
| PF | French Polynesia | 781.071 | 2005 |
| PF | French Polynesia | 726.066 | 2004 |
| PF | French Polynesia | 737.067 | 2003 |
| PF | French Polynesia | 682.062 | 2002 |
| PF | French Polynesia | 678.395 | 2001 |
| PF | French Polynesia | 568.385 | 2000 |
| GA | Gabon | 4118.041 | 2007 |
| GA | Gabon | 4173.046 | 2006 |
| GA | Gabon | 4888.111 | 2005 |
| GA | Gabon | 4686.426 | 2004 |
| GA | Gabon | 4642.422 | 2003 |
| GA | Gabon | 4572.749 | 2002 |
| GA | Gabon | 4800.103 | 2001 |
| GA | Gabon | 4693.760 | 2000 |
| GM | Gambia, The | 352.032 | 2007 |
| GM | Gambia, The | 352.032 | 2006 |
| GM | Gambia, The | 326.363 | 2005 |
| GM | Gambia, The | 322.696 | 2004 |
| GM | Gambia, The | 300.694 | 2003 |
| GM | Gambia, The | 300.694 | 2002 |
| GM | Gambia, The | 300.694 | 2001 |
| GM | Gambia, The | 275.025 | 2000 |
| GE | Georgia | 6420.917 | 2007 |
| GE | Georgia | 6149.559 | 2006 |
| GE | Georgia | 5067.794 | 2005 |
| GE | Georgia | 4323.393 | 2004 |
| GE | Georgia | 3773.343 | 2003 |
| GE | Georgia | 3388.308 | 2002 |
| GE | Georgia | 3769.676 | 2001 |
| GE | Georgia | 4536.079 | 2000 |
| DE | Germany | 781247.016 | 2007 |
| DE | Germany | 816721.574 | 2006 |
| DE | Germany | 797759.517 | 2005 |
| DE | Germany | 815969.839 | 2004 |
| DE | Germany | 823003.145 | 2003 |
| DE | Germany | 829724.756 | 2002 |
| DE | Germany | 853662.932 | 2001 |
| DE | Germany | 829977.779 | 2000 |
| GH | Ghana | 9827.560 | 2007 |
| GH | Ghana | 9358.184 | 2006 |
| GH | Ghana | 6992.969 | 2005 |
| GH | Ghana | 7348.668 | 2004 |
| GH | Ghana | 7631.027 | 2003 |
| GH | Ghana | 7422.008 | 2002 |
| GH | Ghana | 6919.629 | 2001 |
| GH | Ghana | 6288.905 | 2000 |
| GI | Gibraltar | 414.371 | 2007 |
| GI | Gibraltar | 418.038 | 2006 |
| GI | Gibraltar | 399.703 | 2005 |
| GI | Gibraltar | 385.035 | 2004 |
| GI | Gibraltar | 355.699 | 2003 |
| GI | Gibraltar | 348.365 | 2002 |
| GI | Gibraltar | 344.698 | 2001 |
| GI | Gibraltar | 333.697 | 2000 |
| GR | Greece | 98246.264 | 2007 |
| GR | Greece | 97285.510 | 2006 |
| GR | Greece | 98675.303 | 2005 |
| GR | Greece | 97149.831 | 2004 |
| GR | Greece | 95738.036 | 2003 |
| GR | Greece | 93669.848 | 2002 |
| GR | Greece | 93805.527 | 2001 |
| GR | Greece | 91616.328 | 2000 |
| GL | Greenland | 638.058 | 2007 |
| GL | Greenland | 627.057 | 2006 |
| GL | Greenland | 608.722 | 2005 |
| GL | Greenland | 583.053 | 2004 |
| GL | Greenland | 429.039 | 2003 |
| GL | Greenland | 377.701 | 2002 |
| GL | Greenland | 407.037 | 2001 |
| GL | Greenland | 454.708 | 2000 |
| GD | Grenada | 238.355 | 2007 |
| GD | Grenada | 231.021 | 2006 |
| GD | Grenada | 216.353 | 2005 |
| GD | Grenada | 205.352 | 2004 |
| GD | Grenada | 216.353 | 2003 |
| GD | Grenada | 205.352 | 2002 |
| GD | Grenada | 194.351 | 2001 |
| GD | Grenada | 190.684 | 2000 |
| GU | Guam | NA | 2007 |
| GU | Guam | NA | 2006 |
| GU | Guam | NA | 2005 |
| GU | Guam | NA | 2004 |
| GU | Guam | NA | 2003 |
| GU | Guam | NA | 2002 |
| GU | Guam | NA | 2001 |
| GU | Guam | NA | 2000 |
| GT | Guatemala | 12398.127 | 2007 |
| GT | Guatemala | 12405.461 | 2006 |
| GT | Guatemala | 12328.454 | 2005 |
| GT | Guatemala | 11375.034 | 2004 |
| GT | Guatemala | 10619.632 | 2003 |
| GT | Guatemala | 10887.323 | 2002 |
| GT | Guatemala | 10392.278 | 2001 |
| GT | Guatemala | 9915.568 | 2000 |
| GN | Guinea | 1969.179 | 2007 |
| GN | Guinea | 1892.172 | 2006 |
| GN | Guinea | 1826.166 | 2005 |
| GN | Guinea | 1943.510 | 2004 |
| GN | Guinea | 1881.171 | 2003 |
| GN | Guinea | 1804.164 | 2002 |
| GN | Guinea | 1719.823 | 2001 |
| GN | Guinea | 1642.816 | 2000 |
| GW | Guinea-Bissau | 231.021 | 2007 |
| GW | Guinea-Bissau | 216.353 | 2006 |
| GW | Guinea-Bissau | 212.686 | 2005 |
| GW | Guinea-Bissau | 201.685 | 2004 |
| GW | Guinea-Bissau | 194.351 | 2003 |
| GW | Guinea-Bissau | 154.014 | 2002 |
| GW | Guinea-Bissau | 150.347 | 2001 |
| GW | Guinea-Bissau | 146.680 | 2000 |
| GY | Guyana | 1562.142 | 2007 |
| GY | Guyana | 1290.784 | 2006 |
| GY | Guyana | 1437.464 | 2005 |
| GY | Guyana | 1628.148 | 2004 |
| GY | Guyana | 1565.809 | 2003 |
| GY | Guyana | 1580.477 | 2002 |
| GY | Guyana | 1595.145 | 2001 |
| GY | Guyana | 1609.813 | 2000 |
| HT | Haiti | 2390.884 | 2007 |
| HT | Haiti | 2112.192 | 2006 |
| HT | Haiti | 2075.522 | 2005 |
| HT | Haiti | 1987.514 | 2004 |
| HT | Haiti | 1734.491 | 2003 |
| HT | Haiti | 1826.166 | 2002 |
| HT | Haiti | 1569.476 | 2001 |
| HT | Haiti | 1342.122 | 2000 |
| HN | Honduras | 8778.798 | 2007 |
| HN | Honduras | 7620.026 | 2006 |
| HN | Honduras | 7554.020 | 2005 |
| HN | Honduras | 7367.003 | 2004 |
| HN | Honduras | 6769.282 | 2003 |
| HN | Honduras | 6090.887 | 2002 |
| HN | Honduras | 5713.186 | 2001 |
| HN | Honduras | 5031.124 | 2000 |
| HK | Hong Kong SAR, China | 43721.641 | 2007 |
| HK | Hong Kong SAR, China | 42056.823 | 2006 |
| HK | Hong Kong SAR, China | 43871.988 | 2005 |
| HK | Hong Kong SAR, China | 41708.458 | 2004 |
| HK | Hong Kong SAR, China | 43358.608 | 2003 |
| HK | Hong Kong SAR, China | 39636.603 | 2002 |
| HK | Hong Kong SAR, China | 37957.117 | 2001 |
| HK | Hong Kong SAR, China | 40439.676 | 2000 |
| HU | Hungary | 55980.422 | 2007 |
| HU | Hungary | 57384.883 | 2006 |
| HU | Hungary | 58019.274 | 2005 |
| HU | Hungary | 57458.223 | 2004 |
| HU | Hungary | 59053.368 | 2003 |
| HU | Hungary | 56064.763 | 2002 |
| HU | Hungary | 56977.846 | 2001 |
| HU | Hungary | 55826.408 | 2000 |
| IS | Iceland | 2310.210 | 2007 |
| IS | Iceland | 2299.209 | 2006 |
| IS | Iceland | 2229.536 | 2005 |
| IS | Iceland | 2244.204 | 2004 |
| IS | Iceland | 2167.197 | 2003 |
| IS | Iceland | 2170.864 | 2002 |
| IS | Iceland | 2101.191 | 2001 |
| IS | Iceland | 2163.530 | 2000 |
| IN | India | 1407607.286 | 2007 |
| IN | India | 1303717.509 | 2006 |
| IN | India | 1222563.132 | 2005 |
| IN | India | 1154320.262 | 2004 |
| IN | India | 1099597.621 | 2003 |
| IN | India | 1054258.833 | 2002 |
| IN | India | 1041152.975 | 2001 |
| IN | India | 1031853.463 | 2000 |
| ID | Indonesia | 375544.804 | 2007 |
| ID | Indonesia | 345119.705 | 2006 |
| ID | Indonesia | 341991.754 | 2005 |
| ID | Indonesia | 337635.358 | 2004 |
| ID | Indonesia | 316792.130 | 2003 |
| ID | Indonesia | 306737.216 | 2002 |
| ID | Indonesia | 294907.474 | 2001 |
| ID | Indonesia | 263418.945 | 2000 |
| IR | Iran | 519324.207 | 2007 |
| IR | Iran | 509338.966 | 2006 |
| IR | Iran | 468807.615 | 2005 |
| IR | Iran | 447036.636 | 2004 |
| IR | Iran | 418437.703 | 2003 |
| IR | Iran | 401760.187 | 2002 |
| IR | Iran | 398437.885 | 2001 |
| IR | Iran | 372237.170 | 2000 |
| IQ | Iraq | 62155.650 | 2007 |
| IQ | Iraq | 98770.645 | 2006 |
| IQ | Iraq | 113522.986 | 2005 |
| IQ | Iraq | 114084.037 | 2004 |
| IQ | Iraq | 91117.616 | 2003 |
| IQ | Iraq | 87259.932 | 2002 |
| IQ | Iraq | 85342.091 | 2001 |
| IQ | Iraq | 72445.252 | 2000 |
| IE | Ireland | 44469.709 | 2007 |
| IE | Ireland | 43145.922 | 2006 |
| IE | Ireland | 43464.951 | 2005 |
| IE | Ireland | 43761.978 | 2004 |
| IE | Ireland | 42687.547 | 2003 |
| IE | Ireland | 43413.613 | 2002 |
| IE | Ireland | 44029.669 | 2001 |
| IE | Ireland | 41228.081 | 2000 |
| IM | Isle of Man | NA | 2007 |
| IM | Isle of Man | NA | 2006 |
| IM | Isle of Man | NA | 2005 |
| IM | Isle of Man | NA | 2004 |
| IM | Isle of Man | NA | 2003 |
| IM | Isle of Man | NA | 2002 |
| IM | Isle of Man | NA | 2001 |
| IM | Isle of Man | NA | 2000 |
| IL | Israel | 63072.400 | 2007 |
| IL | Israel | 62471.012 | 2006 |
| IL | Israel | 56952.177 | 2005 |
| IL | Israel | 59020.365 | 2004 |
| IL | Israel | 62889.050 | 2003 |
| IL | Israel | 59812.437 | 2002 |
| IL | Israel | 63596.781 | 2001 |
| IL | Israel | 60259.811 | 2000 |
| IT | Italy | 462676.391 | 2007 |
| IT | Italy | 469346.664 | 2006 |
| IT | Italy | 473384.031 | 2005 |
| IT | Italy | 473970.751 | 2004 |
| IT | Italy | 468349.240 | 2003 |
| IT | Italy | 452610.476 | 2002 |
| IT | Italy | 450347.937 | 2001 |
| IT | Italy | 450564.290 | 2000 |
| JM | Jamaica | 9651.544 | 2007 |
| JM | Jamaica | 11496.045 | 2006 |
| JM | Jamaica | 10498.621 | 2005 |
| JM | Jamaica | 10670.970 | 2004 |
| JM | Jamaica | 10667.303 | 2003 |
| JM | Jamaica | 10241.931 | 2002 |
| JM | Jamaica | 10615.965 | 2001 |
| JM | Jamaica | 10307.937 | 2000 |
| JP | Japan | 1251554.434 | 2007 |
| JP | Japan | 1234755.907 | 2006 |
| JP | Japan | 1240945.803 | 2005 |
| JP | Japan | 1262394.086 | 2004 |
| JP | Japan | 1240953.137 | 2003 |
| JP | Japan | 1218980.473 | 2002 |
| JP | Japan | 1201331.202 | 2001 |
| JP | Japan | 1219281.167 | 2000 |
| JO | Jordan | 22035.003 | 2007 |
| JO | Jordan | 21121.920 | 2006 |
| JO | Jordan | 21059.581 | 2005 |
| JO | Jordan | 19240.749 | 2004 |
| JO | Jordan | 17469.588 | 2003 |
| JO | Jordan | 16886.535 | 2002 |
| JO | Jordan | 16002.788 | 2001 |
| JO | Jordan | 15507.743 | 2000 |
| KZ | Kazakhstan | 222348.545 | 2007 |
| KZ | Kazakhstan | 192631.177 | 2006 |
| KZ | Kazakhstan | 177328.786 | 2005 |
| KZ | Kazakhstan | 173053.064 | 2004 |
| KZ | Kazakhstan | 142209.927 | 2003 |
| KZ | Kazakhstan | 133735.490 | 2002 |
| KZ | Kazakhstan | 131850.652 | 2001 |
| KZ | Kazakhstan | 118099.402 | 2000 |
| KE | Kenya | 9831.227 | 2007 |
| KE | Kenya | 9574.537 | 2006 |
| KE | Kenya | 8562.445 | 2005 |
| KE | Kenya | 7623.693 | 2004 |
| KE | Kenya | 6754.614 | 2003 |
| KE | Kenya | 7968.391 | 2002 |
| KE | Kenya | 9369.185 | 2001 |
| KE | Kenya | 10417.947 | 2000 |
| KI | Kiribati | 58.672 | 2007 |
| KI | Kiribati | 66.006 | 2006 |
| KI | Kiribati | 58.672 | 2005 |
| KI | Kiribati | 47.671 | 2004 |
| KI | Kiribati | 44.004 | 2003 |
| KI | Kiribati | 40.337 | 2002 |
| KI | Kiribati | 29.336 | 2001 |
| KI | Kiribati | 33.003 | 2000 |
| KP | North Korea | 64227.505 | 2007 |
| KP | North Korea | 76900.657 | 2006 |
| KP | North Korea | 75573.203 | 2005 |
| KP | North Korea | 72357.244 | 2004 |
| KP | North Korea | 70751.098 | 2003 |
| KP | North Korea | 69225.626 | 2002 |
| KP | North Korea | 72225.232 | 2001 |
| KP | North Korea | 69661.999 | 2000 |
| KR | South Korea | 495675.724 | 2007 |
| KR | South Korea | 470655.783 | 2006 |
| KR | South Korea | 462918.413 | 2005 |
| KR | South Korea | 482276.506 | 2004 |
| KR | South Korea | 466215.046 | 2003 |
| KR | South Korea | 465631.993 | 2002 |
| KR | South Korea | 450193.923 | 2001 |
| KR | South Korea | 447561.017 | 2000 |
| XK | Kosovo | NA | 2007 |
| XK | Kosovo | NA | 2006 |
| XK | Kosovo | NA | 2005 |
| XK | Kosovo | NA | 2004 |
| XK | Kosovo | NA | 2003 |
| XK | Kosovo | NA | 2002 |
| XK | Kosovo | NA | 2001 |
| XK | Kosovo | NA | 2000 |
| KW | Kuwait | 75235.839 | 2007 |
| KW | Kuwait | 73769.039 | 2006 |
| KW | Kuwait | 71546.837 | 2005 |
| KW | Kuwait | 63534.442 | 2004 |
| KW | Kuwait | 59922.447 | 2003 |
| KW | Kuwait | 58228.293 | 2002 |
| KW | Kuwait | 57641.573 | 2001 |
| KW | Kuwait | 53560.202 | 2000 |
| KG | Kyrgyzstan | 6629.936 | 2007 |
| KG | Kyrgyzstan | 5507.834 | 2006 |
| KG | Kyrgyzstan | 5592.175 | 2005 |
| KG | Kyrgyzstan | 5874.534 | 2004 |
| KG | Kyrgyzstan | 5438.161 | 2003 |
| KG | Kyrgyzstan | 4957.784 | 2002 |
| KG | Kyrgyzstan | 3894.354 | 2001 |
| KG | Kyrgyzstan | 4635.088 | 2000 |
| LA | Lao PDR | 1877.504 | 2007 |
| LA | Lao PDR | 1796.830 | 2006 |
| LA | Lao PDR | 1364.124 | 2005 |
| LA | Lao PDR | 1305.452 | 2004 |
| LA | Lao PDR | 1243.113 | 2003 |
| LA | Lao PDR | 1188.108 | 2002 |
| LA | Lao PDR | 1070.764 | 2001 |
| LA | Lao PDR | 968.088 | 2000 |
| LV | Latvia | 8316.756 | 2007 |
| LV | Latvia | 8012.395 | 2006 |
| LV | Latvia | 7506.349 | 2005 |
| LV | Latvia | 7403.673 | 2004 |
| LV | Latvia | 7370.670 | 2003 |
| LV | Latvia | 6912.295 | 2002 |
| LV | Latvia | 6985.635 | 2001 |
| LV | Latvia | 6351.244 | 2000 |
| LB | Lebanon | 13461.557 | 2007 |
| LB | Lebanon | 14458.981 | 2006 |
| LB | Lebanon | 16208.140 | 2005 |
| LB | Lebanon | 16798.527 | 2004 |
| LB | Lebanon | 18180.986 | 2003 |
| LB | Lebanon | 16002.788 | 2002 |
| LB | Lebanon | 16171.470 | 2001 |
| LB | Lebanon | 15247.386 | 2000 |
| LS | Lesotho | 2075.522 | 2007 |
| LS | Lesotho | 2038.852 | 2006 |
| LS | Lesotho | 2013.183 | 2005 |
| LS | Lesotho | 1983.847 | 2004 |
| LS | Lesotho | 1932.509 | 2003 |
| LS | Lesotho | 1906.840 | 2002 |
| LS | Lesotho | 1877.504 | 2001 |
| LS | Lesotho | 1851.835 | 2000 |
| LR | Liberia | 645.392 | 2007 |
| LR | Liberia | 689.396 | 2006 |
| LR | Liberia | 671.061 | 2005 |
| LR | Liberia | 557.384 | 2004 |
| LR | Liberia | 469.376 | 2003 |
| LR | Liberia | 440.040 | 2002 |
| LR | Liberia | 454.708 | 2001 |
| LR | Liberia | 429.039 | 2000 |
| LY | Libya | 49959.208 | 2007 |
| LY | Libya | 53270.509 | 2006 |
| LY | Libya | 52108.070 | 2005 |
| LY | Libya | 50358.911 | 2004 |
| LY | Libya | 49167.136 | 2003 |
| LY | Libya | 47832.348 | 2002 |
| LY | Libya | 48100.039 | 2001 |
| LY | Libya | 47113.616 | 2000 |
| LI | Liechtenstein | 69.673 | 2007 |
| LI | Liechtenstein | NA | 2006 |
| LI | Liechtenstein | NA | 2005 |
| LI | Liechtenstein | NA | 2004 |
| LI | Liechtenstein | NA | 2003 |
| LI | Liechtenstein | NA | 2002 |
| LI | Liechtenstein | NA | 2001 |
| LI | Liechtenstein | NA | 2000 |
| LT | Lithuania | 15166.712 | 2007 |
| LT | Lithuania | 14158.287 | 2006 |
| LT | Lithuania | 13901.597 | 2005 |
| LT | Lithuania | 13245.204 | 2004 |
| LT | Lithuania | 12823.499 | 2003 |
| LT | Lithuania | 13142.528 | 2002 |
| LT | Lithuania | 12885.838 | 2001 |
| LT | Lithuania | 12163.439 | 2000 |
| LU | Luxembourg | 11019.335 | 2007 |
| LU | Luxembourg | 11349.365 | 2006 |
| LU | Luxembourg | 11547.383 | 2005 |
| LU | Luxembourg | 11268.691 | 2004 |
| LU | Luxembourg | 9904.567 | 2003 |
| LU | Luxembourg | 9416.856 | 2002 |
| LU | Luxembourg | 8800.800 | 2001 |
| LU | Luxembourg | 8239.749 | 2000 |
| MO | Macao SAR, China | 1364.124 | 2007 |
| MO | Macao SAR, China | 1620.814 | 2006 |
| MO | Macao SAR, China | 1829.833 | 2005 |
| MO | Macao SAR, China | 1716.156 | 2004 |
| MO | Macao SAR, China | 1532.806 | 2003 |
| MO | Macao SAR, China | 1518.138 | 2002 |
| MO | Macao SAR, China | 1686.820 | 2001 |
| MO | Macao SAR, China | 1631.815 | 2000 |
| MG | Madagascar | 1815.165 | 2007 |
| MG | Madagascar | 1683.153 | 2006 |
| MG | Madagascar | 1741.825 | 2005 |
| MG | Madagascar | 1807.831 | 2004 |
| MG | Madagascar | 1701.488 | 2003 |
| MG | Madagascar | 1235.779 | 2002 |
| MG | Madagascar | 1741.825 | 2001 |
| MG | Madagascar | 1873.837 | 2000 |
| MW | Malawi | 990.090 | 2007 |
| MW | Malawi | 938.752 | 2006 |
| MW | Malawi | 924.084 | 2005 |
| MW | Malawi | 924.084 | 2004 |
| MW | Malawi | 920.417 | 2003 |
| MW | Malawi | 858.078 | 2002 |
| MW | Malawi | 810.407 | 2001 |
| MW | Malawi | 880.080 | 2000 |
| MY | Malaysia | 184816.800 | 2007 |
| MY | Malaysia | 180108.372 | 2006 |
| MY | Malaysia | 183188.652 | 2005 |
| MY | Malaysia | 171879.624 | 2004 |
| MY | Malaysia | 158256.719 | 2003 |
| MY | Malaysia | 136449.070 | 2002 |
| MY | Malaysia | 135620.328 | 2001 |
| MY | Malaysia | 125734.096 | 2000 |
| MV | Maldives | 781.071 | 2007 |
| MV | Maldives | 759.069 | 2006 |
| MV | Maldives | 601.388 | 2005 |
| MV | Maldives | 667.394 | 2004 |
| MV | Maldives | 506.046 | 2003 |
| MV | Maldives | 594.054 | 2002 |
| MV | Maldives | 462.042 | 2001 |
| MV | Maldives | 451.041 | 2000 |
| ML | Mali | 1298.118 | 2007 |
| ML | Mali | 1081.765 | 2006 |
| ML | Mali | 916.750 | 2005 |
| ML | Mali | 891.081 | 2004 |
| ML | Mali | 858.078 | 2003 |
| ML | Mali | 858.078 | 2002 |
| ML | Mali | 839.743 | 2001 |
| ML | Mali | 832.409 | 2000 |
| MT | Malta | 2724.581 | 2007 |
| MT | Malta | 2574.234 | 2006 |
| MT | Malta | 2698.912 | 2005 |
| MT | Malta | 2574.234 | 2004 |
| MT | Malta | 2581.568 | 2003 |
| MT | Malta | 2299.209 | 2002 |
| MT | Malta | 2486.226 | 2001 |
| MT | Malta | 2115.859 | 2000 |
| MH | Marshall Islands | 124.678 | 2007 |
| MH | Marshall Islands | 121.011 | 2006 |
| MH | Marshall Islands | 113.677 | 2005 |
| MH | Marshall Islands | 117.344 | 2004 |
| MH | Marshall Islands | 106.343 | 2003 |
| MH | Marshall Islands | 110.010 | 2002 |
| MH | Marshall Islands | 102.676 | 2001 |
| MH | Marshall Islands | 99.009 | 2000 |
| MR | Mauritania | 1844.501 | 2007 |
| MR | Mauritania | 1609.813 | 2006 |
| MR | Mauritania | 1587.811 | 2005 |
| MR | Mauritania | 1536.473 | 2004 |
| MR | Mauritania | 1389.793 | 2003 |
| MR | Mauritania | 1349.456 | 2002 |
| MR | Mauritania | 1272.449 | 2001 |
| MR | Mauritania | 1173.440 | 2000 |
| MU | Mauritius | 3689.002 | 2007 |
| MU | Mauritius | 3630.330 | 2006 |
| MU | Mauritius | 3296.633 | 2005 |
| MU | Mauritius | 3091.281 | 2004 |
| MU | Mauritius | 3061.945 | 2003 |
| MU | Mauritius | 2885.929 | 2002 |
| MU | Mauritius | 2863.927 | 2001 |
| MU | Mauritius | 2691.578 | 2000 |
| MX | Mexico | 480520.013 | 2007 |
| MX | Mexico | 479251.231 | 2006 |
| MX | Mexico | 466361.726 | 2005 |
| MX | Mexico | 441308.782 | 2004 |
| MX | Mexico | 440208.682 | 2003 |
| MX | Mexico | 414389.335 | 2002 |
| MX | Mexico | 412977.540 | 2001 |
| MX | Mexico | 398382.880 | 2000 |
| FM | Micronesia, Fed. Sts. | 132.012 | 2007 |
| FM | Micronesia, Fed. Sts. | 121.011 | 2006 |
| FM | Micronesia, Fed. Sts. | 121.011 | 2005 |
| FM | Micronesia, Fed. Sts. | 143.013 | 2004 |
| FM | Micronesia, Fed. Sts. | 143.013 | 2003 |
| FM | Micronesia, Fed. Sts. | 143.013 | 2002 |
| FM | Micronesia, Fed. Sts. | 168.682 | 2001 |
| FM | Micronesia, Fed. Sts. | 124.678 | 2000 |
| MD | Moldova | 4679.092 | 2007 |
| MD | Moldova | 4994.454 | 2006 |
| MD | Moldova | 4895.445 | 2005 |
| MD | Moldova | 4554.414 | 2004 |
| MD | Moldova | 4290.390 | 2003 |
| MD | Moldova | 3986.029 | 2002 |
| MD | Moldova | 3714.671 | 2001 |
| MD | Moldova | 3512.986 | 2000 |
| MC | Monaco | NA | 2007 |
| MC | Monaco | NA | 2006 |
| MC | Monaco | NA | 2005 |
| MC | Monaco | NA | 2004 |
| MC | Monaco | NA | 2003 |
| MC | Monaco | NA | 2002 |
| MC | Monaco | NA | 2001 |
| MC | Monaco | NA | 2000 |
| MN | Mongolia | 12064.430 | 2007 |
| MN | Mongolia | 9394.854 | 2006 |
| MN | Mongolia | 8562.445 | 2005 |
| MN | Mongolia | 8551.444 | 2004 |
| MN | Mongolia | 8034.397 | 2003 |
| MN | Mongolia | 8287.420 | 2002 |
| MN | Mongolia | 7884.050 | 2001 |
| MN | Mongolia | 7506.349 | 2000 |
| ME | Montenegro | 2057.187 | 2007 |
| ME | Montenegro | 2064.521 | 2006 |
| ME | Montenegro | 2057.187 | 2005 |
| ME | Montenegro | NA | 2004 |
| ME | Montenegro | NA | 2003 |
| ME | Montenegro | NA | 2002 |
| ME | Montenegro | NA | 2001 |
| ME | Montenegro | NA | 2000 |
| MA | Morocco | 50267.236 | 2007 |
| MA | Morocco | 47425.311 | 2006 |
| MA | Morocco | 45771.494 | 2005 |
| MA | Morocco | 43310.937 | 2004 |
| MA | Morocco | 37561.081 | 2003 |
| MA | Morocco | 38254.144 | 2002 |
| MA | Morocco | 37715.095 | 2001 |
| MA | Morocco | 33905.082 | 2000 |
| MZ | Mozambique | 2262.539 | 2007 |
| MZ | Mozambique | 1980.180 | 2006 |
| MZ | Mozambique | 1822.499 | 2005 |
| MZ | Mozambique | 1921.508 | 2004 |
| MZ | Mozambique | 1917.841 | 2003 |
| MZ | Mozambique | 1587.811 | 2002 |
| MZ | Mozambique | 1580.477 | 2001 |
| MZ | Mozambique | 1349.456 | 2000 |
| MM | Myanmar | 12874.837 | 2007 |
| MM | Myanmar | 12852.835 | 2006 |
| MM | Myanmar | 11595.054 | 2005 |
| MM | Myanmar | 12434.797 | 2004 |
| MM | Myanmar | 9845.895 | 2003 |
| MM | Myanmar | 9207.837 | 2002 |
| MM | Myanmar | 8723.793 | 2001 |
| MM | Myanmar | 10087.917 | 2000 |
| NA | Namibia | 2361.548 | 2007 |
| NA | Namibia | 2332.212 | 2006 |
| NA | Namibia | 2310.210 | 2005 |
| NA | Namibia | 1961.845 | 2004 |
| NA | Namibia | 1873.837 | 2003 |
| NA | Namibia | 1760.160 | 2002 |
| NA | Namibia | 2016.850 | 2001 |
| NA | Namibia | 1642.816 | 2000 |
| NR | Nauru | 44.004 | 2007 |
| NR | Nauru | 44.004 | 2006 |
| NR | Nauru | 62.339 | 2005 |
| NR | Nauru | 66.006 | 2004 |
| NR | Nauru | 66.006 | 2003 |
| NR | Nauru | 77.007 | 2002 |
| NR | Nauru | 80.674 | 2001 |
| NR | Nauru | 84.341 | 2000 |
| NP | Nepal | 2614.571 | 2007 |
| NP | Nepal | 2563.233 | 2006 |
| NP | Nepal | 3083.947 | 2005 |
| NP | Nepal | 2669.576 | 2004 |
| NP | Nepal | 2841.925 | 2003 |
| NP | Nepal | 2625.572 | 2002 |
| NP | Nepal | 3267.297 | 2001 |
| NP | Nepal | 3069.279 | 2000 |
| NL | Netherlands | 177427.795 | 2007 |
| NL | Netherlands | 180211.048 | 2006 |
| NL | Netherlands | 181927.204 | 2005 |
| NL | Netherlands | 185275.175 | 2004 |
| NL | Netherlands | 183067.641 | 2003 |
| NL | Netherlands | 181817.194 | 2002 |
| NL | Netherlands | 177420.461 | 2001 |
| NL | Netherlands | 173837.802 | 2000 |
| NC | New Caledonia | 2944.601 | 2007 |
| NC | New Caledonia | 2720.914 | 2006 |
| NC | New Caledonia | 2823.590 | 2005 |
| NC | New Caledonia | 2530.230 | 2004 |
| NC | New Caledonia | 2739.249 | 2003 |
| NC | New Caledonia | 2405.552 | 2002 |
| NC | New Caledonia | 1888.505 | 2001 |
| NC | New Caledonia | 2233.203 | 2000 |
| NZ | New Zealand | 33637.391 | 2007 |
| NZ | New Zealand | 33446.707 | 2006 |
| NZ | New Zealand | 34139.770 | 2005 |
| NZ | New Zealand | 34554.141 | 2004 |
| NZ | New Zealand | 34081.098 | 2003 |
| NZ | New Zealand | 33201.018 | 2002 |
| NZ | New Zealand | 34447.798 | 2001 |
| NZ | New Zealand | 32980.998 | 2000 |
| NI | Nicaragua | 4605.752 | 2007 |
| NI | Nicaragua | 4470.073 | 2006 |
| NI | Nicaragua | 4319.726 | 2005 |
| NI | Nicaragua | 4426.069 | 2004 |
| NI | Nicaragua | 4411.401 | 2003 |
| NI | Nicaragua | 4037.367 | 2002 |
| NI | Nicaragua | 3964.027 | 2001 |
| NI | Nicaragua | 3762.342 | 2000 |
| NE | Niger | 722.399 | 2007 |
| NE | Niger | 693.063 | 2006 |
| NE | Niger | 715.065 | 2005 |
| NE | Niger | 814.074 | 2004 |
| NE | Niger | 759.069 | 2003 |
| NE | Niger | 700.397 | 2002 |
| NE | Niger | 656.393 | 2001 |
| NE | Niger | 696.730 | 2000 |
| NG | Nigeria | 94868.957 | 2007 |
| NG | Nigeria | 98238.930 | 2006 |
| NG | Nigeria | 106119.313 | 2005 |
| NG | Nigeria | 98997.999 | 2004 |
| NG | Nigeria | 100318.119 | 2003 |
| NG | Nigeria | 94586.598 | 2002 |
| NG | Nigeria | 87017.910 | 2001 |
| NG | Nigeria | 79122.859 | 2000 |
| MK | North Macedonia | 9493.863 | 2007 |
| MK | North Macedonia | 10938.661 | 2006 |
| MK | North Macedonia | 11279.692 | 2005 |
| MK | North Macedonia | 11191.684 | 2004 |
| MK | North Macedonia | 11309.028 | 2003 |
| MK | North Macedonia | 10934.994 | 2002 |
| MK | North Macedonia | 11998.424 | 2001 |
| MK | North Macedonia | 12064.430 | 2000 |
| MP | Northern Mariana Islands | NA | 2007 |
| MP | Northern Mariana Islands | NA | 2006 |
| MP | Northern Mariana Islands | NA | 2005 |
| MP | Northern Mariana Islands | NA | 2004 |
| MP | Northern Mariana Islands | NA | 2003 |
| MP | Northern Mariana Islands | NA | 2002 |
| MP | Northern Mariana Islands | NA | 2001 |
| MP | Northern Mariana Islands | NA | 2000 |
| NO | Norway | 45089.432 | 2007 |
| NO | Norway | 44257.023 | 2006 |
| NO | Norway | 42438.191 | 2005 |
| NO | Norway | 42647.210 | 2004 |
| NO | Norway | 45221.444 | 2003 |
| NO | Norway | 38023.123 | 2002 |
| NO | Norway | 41910.143 | 2001 |
| NO | Norway | 39673.273 | 2000 |
| OM | Oman | 44198.351 | 2007 |
| OM | Oman | 39603.600 | 2006 |
| OM | Oman | 29893.384 | 2005 |
| OM | Oman | 27986.544 | 2004 |
| OM | Oman | 32390.611 | 2003 |
| OM | Oman | 25470.982 | 2002 |
| OM | Oman | 20285.844 | 2001 |
| OM | Oman | 21690.305 | 2000 |
| PK | Pakistan | 158894.777 | 2007 |
| PK | Pakistan | 146074.945 | 2006 |
| PK | Pakistan | 136636.087 | 2005 |
| PK | Pakistan | 131601.296 | 2004 |
| PK | Pakistan | 118895.141 | 2003 |
| PK | Pakistan | 114084.037 | 2002 |
| PK | Pakistan | 108282.843 | 2001 |
| PK | Pakistan | 106449.343 | 2000 |
| PW | Palau | 253.023 | 2007 |
| PW | Palau | 227.354 | 2006 |
| PW | Palau | 220.020 | 2005 |
| PW | Palau | 216.353 | 2004 |
| PW | Palau | 212.686 | 2003 |
| PW | Palau | 212.686 | 2002 |
| PW | Palau | 216.353 | 2001 |
| PW | Palau | 209.019 | 2000 |
| PA | Panama | 7304.664 | 2007 |
| PA | Panama | 7469.679 | 2006 |
| PA | Panama | 6838.955 | 2005 |
| PA | Panama | 5804.861 | 2004 |
| PA | Panama | 6153.226 | 2003 |
| PA | Panama | 5870.867 | 2002 |
| PA | Panama | 7007.637 | 2001 |
| PA | Panama | 5790.193 | 2000 |
| PG | Papua New Guinea | 6120.223 | 2007 |
| PG | Papua New Guinea | 4308.725 | 2006 |
| PG | Papua New Guinea | 4385.732 | 2005 |
| PG | Papua New Guinea | 4488.408 | 2004 |
| PG | Papua New Guinea | 3945.692 | 2003 |
| PG | Papua New Guinea | 3487.317 | 2002 |
| PG | Papua New Guinea | 3208.625 | 2001 |
| PG | Papua New Guinea | 2665.909 | 2000 |
| PY | Paraguay | 4136.376 | 2007 |
| PY | Paraguay | 3986.029 | 2006 |
| PY | Paraguay | 3832.015 | 2005 |
| PY | Paraguay | 4088.705 | 2004 |
| PY | Paraguay | 4070.370 | 2003 |
| PY | Paraguay | 3898.021 | 2002 |
| PY | Paraguay | 3821.014 | 2001 |
| PY | Paraguay | 3689.002 | 2000 |
| PE | Peru | 35071.188 | 2007 |
| PE | Peru | 28723.611 | 2006 |
| PE | Peru | 37135.709 | 2005 |
| PE | Peru | 31895.566 | 2004 |
| PE | Peru | 26380.398 | 2003 |
| PE | Peru | 27187.138 | 2002 |
| PE | Peru | 27165.136 | 2001 |
| PE | Peru | 30296.754 | 2000 |
| PH | Philippines | 72170.227 | 2007 |
| PH | Philippines | 67692.820 | 2006 |
| PH | Philippines | 74832.469 | 2005 |
| PH | Philippines | 74066.066 | 2004 |
| PH | Philippines | 71425.826 | 2003 |
| PH | Philippines | 71337.818 | 2002 |
| PH | Philippines | 71051.792 | 2001 |
| PH | Philippines | 73306.997 | 2000 |
| PL | Poland | 314272.901 | 2007 |
| PL | Poland | 318940.992 | 2006 |
| PL | Poland | 302538.501 | 2005 |
| PL | Poland | 304416.005 | 2004 |
| PL | Poland | 302252.475 | 2003 |
| PL | Poland | 294834.134 | 2002 |
| PL | Poland | 301284.387 | 2001 |
| PL | Poland | 299289.539 | 2000 |
| PT | Portugal | 60149.801 | 2007 |
| PT | Portugal | 59816.104 | 2006 |
| PT | Portugal | 65279.934 | 2005 |
| PT | Portugal | 63145.740 | 2004 |
| PT | Portugal | 61216.898 | 2003 |
| PT | Portugal | 66790.738 | 2002 |
| PT | Portugal | 62757.038 | 2001 |
| PT | Portugal | 62731.369 | 2000 |
| PR | Puerto Rico | NA | 2007 |
| PR | Puerto Rico | NA | 2006 |
| PR | Puerto Rico | NA | 2005 |
| PR | Puerto Rico | NA | 2004 |
| PR | Puerto Rico | NA | 2003 |
| PR | Puerto Rico | NA | 2002 |
| PR | Puerto Rico | NA | 2001 |
| PR | Puerto Rico | NA | 2000 |
| QA | Qatar | 63277.752 | 2007 |
| QA | Qatar | 63475.770 | 2006 |
| QA | Qatar | 50956.632 | 2005 |
| QA | Qatar | 42944.237 | 2004 |
| QA | Qatar | 41521.441 | 2003 |
| QA | Qatar | 40905.385 | 2002 |
| QA | Qatar | 41396.763 | 2001 |
| QA | Qatar | 34730.157 | 2000 |
| RO | Romania | 102224.959 | 2007 |
| RO | Romania | 103350.728 | 2006 |
| RO | Romania | 96456.768 | 2005 |
| RO | Romania | 96904.142 | 2004 |
| RO | Romania | 101062.520 | 2003 |
| RO | Romania | 97237.839 | 2002 |
| RO | Romania | 96632.784 | 2001 |
| RO | Romania | 90681.243 | 2000 |
| RU | Russia | 1666886.188 | 2007 |
| RU | Russia | 1669262.404 | 2006 |
| RU | Russia | 1615089.813 | 2005 |
| RU | Russia | 1602115.967 | 2004 |
| RU | Russia | 1604242.827 | 2003 |
| RU | Russia | 1557085.207 | 2002 |
| RU | Russia | 1557506.912 | 2001 |
| RU | Russia | 1557899.281 | 2000 |
| RW | Rwanda | 557.384 | 2007 |
| RW | Rwanda | 528.048 | 2006 |
| RW | Rwanda | 528.048 | 2005 |
| RW | Rwanda | 528.048 | 2004 |
| RW | Rwanda | 520.714 | 2003 |
| RW | Rwanda | 531.715 | 2002 |
| RW | Rwanda | 531.715 | 2001 |
| RW | Rwanda | 528.048 | 2000 |
| WS | Samoa | 172.349 | 2007 |
| WS | Samoa | 165.015 | 2006 |
| WS | Samoa | 161.348 | 2005 |
| WS | Samoa | 150.347 | 2004 |
| WS | Samoa | 154.014 | 2003 |
| WS | Samoa | 146.680 | 2002 |
| WS | Samoa | 146.680 | 2001 |
| WS | Samoa | 143.013 | 2000 |
| SM | San Marino | NA | 2007 |
| SM | San Marino | NA | 2006 |
| SM | San Marino | NA | 2005 |
| SM | San Marino | NA | 2004 |
| SM | San Marino | NA | 2003 |
| SM | San Marino | NA | 2002 |
| SM | San Marino | NA | 2001 |
| SM | San Marino | NA | 2000 |
| ST | Sao Tome and Principe | 84.341 | 2007 |
| ST | Sao Tome and Principe | 84.341 | 2006 |
| ST | Sao Tome and Principe | 77.007 | 2005 |
| ST | Sao Tome and Principe | 73.340 | 2004 |
| ST | Sao Tome and Principe | 66.006 | 2003 |
| ST | Sao Tome and Principe | 58.672 | 2002 |
| ST | Sao Tome and Principe | 51.338 | 2001 |
| ST | Sao Tome and Principe | 47.671 | 2000 |
| SA | Saudi Arabia | 387777.916 | 2007 |
| SA | Saudi Arabia | 432739.003 | 2006 |
| SA | Saudi Arabia | 397642.146 | 2005 |
| SA | Saudi Arabia | 395834.315 | 2004 |
| SA | Saudi Arabia | 327272.416 | 2003 |
| SA | Saudi Arabia | 326407.004 | 2002 |
| SA | Saudi Arabia | 297214.017 | 2001 |
| SA | Saudi Arabia | 296935.325 | 2000 |
| SN | Senegal | 5181.471 | 2007 |
| SN | Senegal | 4730.430 | 2006 |
| SN | Senegal | 5812.195 | 2005 |
| SN | Senegal | 5232.809 | 2004 |
| SN | Senegal | 4976.119 | 2003 |
| SN | Senegal | 4510.410 | 2002 |
| SN | Senegal | 4330.727 | 2001 |
| SN | Senegal | 3938.358 | 2000 |
| RS | Republic of Serbia | 59805.103 | 2007 |
| RS | Republic of Serbia | 61066.551 | 2006 |
| RS | Republic of Serbia | NA | 2005 |
| RS | Republic of Serbia | NA | 2004 |
| RS | Republic of Serbia | NA | 2003 |
| RS | Republic of Serbia | NA | 2002 |
| RS | Republic of Serbia | NA | 2001 |
| RS | Republic of Serbia | NA | 2000 |
| SC | Seychelles | 641.725 | 2007 |
| SC | Seychelles | 733.400 | 2006 |
| SC | Seychelles | 689.396 | 2005 |
| SC | Seychelles | 737.067 | 2004 |
| SC | Seychelles | 550.050 | 2003 |
| SC | Seychelles | 539.049 | 2002 |
| SC | Seychelles | 634.391 | 2001 |
| SC | Seychelles | 572.052 | 2000 |
| SL | Sierra Leone | 641.725 | 2007 |
| SL | Sierra Leone | 733.400 | 2006 |
| SL | Sierra Leone | 546.383 | 2005 |
| SL | Sierra Leone | 641.725 | 2004 |
| SL | Sierra Leone | 652.726 | 2003 |
| SL | Sierra Leone | 608.722 | 2002 |
| SL | Sierra Leone | 568.385 | 2001 |
| SL | Sierra Leone | 425.372 | 2000 |
| SG | Singapore | 19926.478 | 2007 |
| SG | Singapore | 30799.133 | 2006 |
| SG | Singapore | 30359.093 | 2005 |
| SG | Singapore | 28474.255 | 2004 |
| SG | Singapore | 31132.830 | 2003 |
| SG | Singapore | 47230.960 | 2002 |
| SG | Singapore | 49541.170 | 2001 |
| SG | Singapore | 49005.788 | 2000 |
| SX | Sint Maarten (Dutch part) | NA | 2007 |
| SX | Sint Maarten (Dutch part) | NA | 2006 |
| SX | Sint Maarten (Dutch part) | NA | 2005 |
| SX | Sint Maarten (Dutch part) | NA | 2004 |
| SX | Sint Maarten (Dutch part) | NA | 2003 |
| SX | Sint Maarten (Dutch part) | NA | 2002 |
| SX | Sint Maarten (Dutch part) | NA | 2001 |
| SX | Sint Maarten (Dutch part) | NA | 2000 |
| SK | Slovakia | 36780.010 | 2007 |
| SK | Slovakia | 39104.888 | 2006 |
| SK | Slovakia | 39357.911 | 2005 |
| SK | Slovakia | 38749.189 | 2004 |
| SK | Slovakia | 39493.590 | 2003 |
| SK | Slovakia | 39251.568 | 2002 |
| SK | Slovakia | 39357.911 | 2001 |
| SK | Slovakia | 35885.262 | 2000 |
| SI | Slovenia | 16244.810 | 2007 |
| SI | Slovenia | 16244.810 | 2006 |
| SI | Slovenia | 15867.109 | 2005 |
| SI | Slovenia | 15746.098 | 2004 |
| SI | Slovenia | 15511.410 | 2003 |
| SI | Slovenia | 15419.735 | 2002 |
| SI | Slovenia | 15163.045 | 2001 |
| SI | Slovenia | 14396.642 | 2000 |
| SB | Solomon Islands | 179.683 | 2007 |
| SB | Solomon Islands | 165.015 | 2006 |
| SB | Solomon Islands | 161.348 | 2005 |
| SB | Solomon Islands | 161.348 | 2004 |
| SB | Solomon Islands | 161.348 | 2003 |
| SB | Solomon Islands | 157.681 | 2002 |
| SB | Solomon Islands | 157.681 | 2001 |
| SB | Solomon Islands | 154.014 | 2000 |
| SO | Somalia | 608.722 | 2007 |
| SO | Somalia | 594.054 | 2006 |
| SO | Somalia | 594.054 | 2005 |
| SO | Somalia | 594.054 | 2004 |
| SO | Somalia | 594.054 | 2003 |
| SO | Somalia | 586.720 | 2002 |
| SO | Somalia | 502.379 | 2001 |
| SO | Somalia | 480.377 | 2000 |
| ZA | South Africa | 466578.079 | 2007 |
| ZA | South Africa | 447894.714 | 2006 |
| ZA | South Africa | 416915.898 | 2005 |
| ZA | South Africa | 450186.589 | 2004 |
| ZA | South Africa | 404459.099 | 2003 |
| ZA | South Africa | 356637.752 | 2002 |
| ZA | South Africa | 372042.819 | 2001 |
| ZA | South Africa | 378665.421 | 2000 |
| SS | South Sudan | NA | 2007 |
| SS | South Sudan | NA | 2006 |
| SS | South Sudan | NA | 2005 |
| SS | South Sudan | NA | 2004 |
| SS | South Sudan | NA | 2003 |
| SS | South Sudan | NA | 2002 |
| SS | South Sudan | NA | 2001 |
| SS | South Sudan | NA | 2000 |
| ES | Spain | 358236.564 | 2007 |
| ES | Spain | 350037.152 | 2006 |
| ES | Spain | 353462.130 | 2005 |
| ES | Spain | 339428.521 | 2004 |
| ES | Spain | 321097.188 | 2003 |
| ES | Spain | 314518.590 | 2002 |
| ES | Spain | 297830.073 | 2001 |
| ES | Spain | 294434.431 | 2000 |
| LK | Sri Lanka | 12354.123 | 2007 |
| LK | Sri Lanka | 11976.422 | 2006 |
| LK | Sri Lanka | 12101.100 | 2005 |
| LK | Sri Lanka | 12299.118 | 2004 |
| LK | Sri Lanka | 11078.007 | 2003 |
| LK | Sri Lanka | 11056.005 | 2002 |
| LK | Sri Lanka | 10443.616 | 2001 |
| LK | Sri Lanka | 10238.264 | 2000 |
| KN | St. Kitts and Nevis | 216.353 | 2007 |
| KN | St. Kitts and Nevis | 201.685 | 2006 |
| KN | St. Kitts and Nevis | 198.018 | 2005 |
| KN | St. Kitts and Nevis | 212.686 | 2004 |
| KN | St. Kitts and Nevis | 198.018 | 2003 |
| KN | St. Kitts and Nevis | 198.018 | 2002 |
| KN | St. Kitts and Nevis | 176.016 | 2001 |
| KN | St. Kitts and Nevis | 172.349 | 2000 |
| LC | St. Lucia | 385.035 | 2007 |
| LC | St. Lucia | 366.700 | 2006 |
| LC | St. Lucia | 366.700 | 2005 |
| LC | St. Lucia | 355.699 | 2004 |
| LC | St. Lucia | 359.366 | 2003 |
| LC | St. Lucia | 289.693 | 2002 |
| LC | St. Lucia | 348.365 | 2001 |
| LC | St. Lucia | 348.365 | 2000 |
| MF | St. Martin (French part) | NA | 2007 |
| MF | St. Martin (French part) | NA | 2006 |
| MF | St. Martin (French part) | NA | 2005 |
| MF | St. Martin (French part) | NA | 2004 |
| MF | St. Martin (French part) | NA | 2003 |
| MF | St. Martin (French part) | NA | 2002 |
| MF | St. Martin (French part) | NA | 2001 |
| MF | St. Martin (French part) | NA | 2000 |
| VC | St. Vincent and the Grenadines | 227.354 | 2007 |
| VC | St. Vincent and the Grenadines | 220.020 | 2006 |
| VC | St. Vincent and the Grenadines | 220.020 | 2005 |
| VC | St. Vincent and the Grenadines | 220.020 | 2004 |
| VC | St. Vincent and the Grenadines | 198.018 | 2003 |
| VC | St. Vincent and the Grenadines | 187.017 | 2002 |
| VC | St. Vincent and the Grenadines | 179.683 | 2001 |
| VC | St. Vincent and the Grenadines | 146.680 | 2000 |
| SD | Sudan | 14125.284 | 2007 |
| SD | Sudan | 12013.092 | 2006 |
| SD | Sudan | 10982.665 | 2005 |
| SD | Sudan | 11463.042 | 2004 |
| SD | Sudan | 9072.158 | 2003 |
| SD | Sudan | 8118.738 | 2002 |
| SD | Sudan | 6369.579 | 2001 |
| SD | Sudan | 5533.503 | 2000 |
| SR | Suriname | 1763.827 | 2007 |
| SR | Suriname | 1745.492 | 2006 |
| SR | Suriname | 1595.145 | 2005 |
| SR | Suriname | 1562.142 | 2004 |
| SR | Suriname | 1543.807 | 2003 |
| SR | Suriname | 1565.809 | 2002 |
| SR | Suriname | 2368.882 | 2001 |
| SR | Suriname | 2196.533 | 2000 |
| SE | Sweden | 48059.702 | 2007 |
| SE | Sweden | 49570.506 | 2006 |
| SE | Sweden | 51561.687 | 2005 |
| SE | Sweden | 54520.956 | 2004 |
| SE | Sweden | 54781.313 | 2003 |
| SE | Sweden | 57425.220 | 2002 |
| SE | Sweden | 51125.314 | 2001 |
| SE | Sweden | 49350.486 | 2000 |
| CH | Switzerland | 38107.464 | 2007 |
| CH | Switzerland | 41994.484 | 2006 |
| CH | Switzerland | 41444.434 | 2005 |
| CH | Switzerland | 40443.343 | 2004 |
| CH | Switzerland | 40193.987 | 2003 |
| CH | Switzerland | 40758.705 | 2002 |
| CH | Switzerland | 42984.574 | 2001 |
| CH | Switzerland | 39101.221 | 2000 |
| SY | Syria | 66468.042 | 2007 |
| SY | Syria | 53582.204 | 2006 |
| SY | Syria | 50626.602 | 2005 |
| SY | Syria | 51103.312 | 2004 |
| SY | Syria | 54275.267 | 2003 |
| SY | Syria | 39064.551 | 2002 |
| SY | Syria | 48778.434 | 2001 |
| SY | Syria | 51040.973 | 2000 |
| TJ | Tajikistan | 3234.294 | 2007 |
| TJ | Tajikistan | 2658.575 | 2006 |
| TJ | Tajikistan | 2442.222 | 2005 |
| TJ | Tajikistan | 2563.233 | 2004 |
| TJ | Tajikistan | 2075.522 | 2003 |
| TJ | Tajikistan | 1881.171 | 2002 |
| TJ | Tajikistan | 2291.875 | 2001 |
| TJ | Tajikistan | 2236.870 | 2000 |
| TZ | United Republic of Tanzania | 5896.536 | 2007 |
| TZ | United Republic of Tanzania | 6028.548 | 2006 |
| TZ | United Republic of Tanzania | 5504.167 | 2005 |
| TZ | United Republic of Tanzania | 4363.730 | 2004 |
| TZ | United Republic of Tanzania | 3806.346 | 2003 |
| TZ | United Republic of Tanzania | 3589.993 | 2002 |
| TZ | United Republic of Tanzania | 3127.951 | 2001 |
| TZ | United Republic of Tanzania | 2651.241 | 2000 |
| TH | Thailand | 234027.940 | 2007 |
| TH | Thailand | 231127.343 | 2006 |
| TH | Thailand | 227493.346 | 2005 |
| TH | Thailand | 221442.796 | 2004 |
| TH | Thailand | 205880.048 | 2003 |
| TH | Thailand | 194589.355 | 2002 |
| TH | Thailand | 184699.456 | 2001 |
| TH | Thailand | 172697.365 | 2000 |
| TL | East Timor | 183.350 | 2007 |
| TL | East Timor | 179.683 | 2006 |
| TL | East Timor | 176.016 | 2005 |
| TL | East Timor | 176.016 | 2004 |
| TL | East Timor | 161.348 | 2003 |
| TL | East Timor | 161.348 | 2002 |
| TL | East Timor | NA | 2001 |
| TL | East Timor | NA | 2000 |
| TG | Togo | 1408.128 | 2007 |
| TG | Togo | 1221.111 | 2006 |
| TG | Togo | 1338.455 | 2005 |
| TG | Togo | 1397.127 | 2004 |
| TG | Togo | 1463.133 | 2003 |
| TG | Togo | 1232.112 | 2002 |
| TG | Togo | 1162.439 | 2001 |
| TG | Togo | 1360.457 | 2000 |
| TO | Tonga | 113.677 | 2007 |
| TO | Tonga | 128.345 | 2006 |
| TO | Tonga | 113.677 | 2005 |
| TO | Tonga | 110.010 | 2004 |
| TO | Tonga | 117.344 | 2003 |
| TO | Tonga | 102.676 | 2002 |
| TO | Tonga | 88.008 | 2001 |
| TO | Tonga | 95.342 | 2000 |
| TT | Trinidad and Tobago | 45474.467 | 2007 |
| TT | Trinidad and Tobago | 42676.546 | 2006 |
| TT | Trinidad and Tobago | 38151.468 | 2005 |
| TT | Trinidad and Tobago | 33432.039 | 2004 |
| TT | Trinidad and Tobago | 31987.241 | 2003 |
| TT | Trinidad and Tobago | 28620.935 | 2002 |
| TT | Trinidad and Tobago | 26354.729 | 2001 |
| TT | Trinidad and Tobago | 23839.167 | 2000 |
| TN | Tunisia | 24110.525 | 2007 |
| TN | Tunisia | 22992.090 | 2006 |
| TN | Tunisia | 22662.060 | 2005 |
| TN | Tunisia | 22299.027 | 2004 |
| TN | Tunisia | 21246.598 | 2003 |
| TN | Tunisia | 20861.563 | 2002 |
| TN | Tunisia | 20817.559 | 2001 |
| TN | Tunisia | 19922.811 | 2000 |
| TR | Turkey | 284808.556 | 2007 |
| TR | Turkey | 261614.781 | 2006 |
| TR | Turkey | 237390.579 | 2005 |
| TR | Turkey | 225421.491 | 2004 |
| TR | Turkey | 218523.864 | 2003 |
| TR | Turkey | 205685.697 | 2002 |
| TR | Turkey | 194567.353 | 2001 |
| TR | Turkey | 216151.315 | 2000 |
| TM | Turkmenistan | 56042.761 | 2007 |
| TM | Turkmenistan | 49511.834 | 2006 |
| TM | Turkmenistan | 48338.394 | 2005 |
| TM | Turkmenistan | 46541.564 | 2004 |
| TM | Turkmenistan | 44601.721 | 2003 |
| TM | Turkmenistan | 39966.633 | 2002 |
| TM | Turkmenistan | 38074.461 | 2001 |
| TM | Turkmenistan | 37539.079 | 2000 |
| TC | Turks and Caicos Islands | 165.015 | 2007 |
| TC | Turks and Caicos Islands | 143.013 | 2006 |
| TC | Turks and Caicos Islands | 121.011 | 2005 |
| TC | Turks and Caicos Islands | 102.676 | 2004 |
| TC | Turks and Caicos Islands | 102.676 | 2003 |
| TC | Turks and Caicos Islands | 99.009 | 2002 |
| TC | Turks and Caicos Islands | 73.340 | 2001 |
| TC | Turks and Caicos Islands | 69.673 | 2000 |
| TV | Tuvalu | 11.001 | 2007 |
| TV | Tuvalu | 7.334 | 2006 |
| TV | Tuvalu | 11.001 | 2005 |
| TV | Tuvalu | 11.001 | 2004 |
| TV | Tuvalu | 11.001 | 2003 |
| TV | Tuvalu | 11.001 | 2002 |
| TV | Tuvalu | 7.334 | 2001 |
| TV | Tuvalu | 7.334 | 2000 |
| UG | Uganda | 2889.596 | 2007 |
| UG | Uganda | 2537.564 | 2006 |
| UG | Uganda | 2170.864 | 2005 |
| UG | Uganda | 1738.158 | 2004 |
| UG | Uganda | 1628.148 | 2003 |
| UG | Uganda | 1558.475 | 2002 |
| UG | Uganda | 1510.804 | 2001 |
| UG | Uganda | 1437.464 | 2000 |
| UA | Ukraine | 321258.536 | 2007 |
| UA | Ukraine | 326429.006 | 2006 |
| UA | Ukraine | 333876.683 | 2005 |
| UA | Ukraine | 343396.215 | 2004 |
| UA | Ukraine | 352431.703 | 2003 |
| UA | Ukraine | 318687.969 | 2002 |
| UA | Ukraine | 321775.583 | 2001 |
| UA | Ukraine | 320902.837 | 2000 |
| AE | United Arab Emirates | 135554.322 | 2007 |
| AE | United Arab Emirates | 123728.247 | 2006 |
| AE | United Arab Emirates | 116071.551 | 2005 |
| AE | United Arab Emirates | 113174.621 | 2004 |
| AE | United Arab Emirates | 106783.040 | 2003 |
| AE | United Arab Emirates | 84656.362 | 2002 |
| AE | United Arab Emirates | 101403.551 | 2001 |
| AE | United Arab Emirates | 112562.232 | 2000 |
| GB | United Kingdom | 528425.701 | 2007 |
| GB | United Kingdom | 541458.219 | 2006 |
| GB | United Kingdom | 542580.321 | 2005 |
| GB | United Kingdom | 539239.684 | 2004 |
| GB | United Kingdom | 540006.087 | 2003 |
| GB | United Kingdom | 528642.054 | 2002 |
| GB | United Kingdom | 545862.286 | 2001 |
| GB | United Kingdom | 541784.582 | 2000 |
| US | United States of America | 5789030.561 | 2007 |
| US | United States of America | 5697285.888 | 2006 |
| US | United States of America | 5789727.291 | 2005 |
| US | United States of America | 5756075.232 | 2004 |
| US | United States of America | 5675701.926 | 2003 |
| US | United States of America | 5641309.133 | 2002 |
| US | United States of America | 5595794.329 | 2001 |
| US | United States of America | 5693684.894 | 2000 |
| UY | Uruguay | 6002.879 | 2007 |
| UY | Uruguay | 6648.271 | 2006 |
| UY | Uruguay | 5775.525 | 2005 |
| UY | Uruguay | 5610.510 | 2004 |
| UY | Uruguay | 4598.418 | 2003 |
| UY | Uruguay | 4620.420 | 2002 |
| UY | Uruguay | 5089.796 | 2001 |
| UY | Uruguay | 5306.149 | 2000 |
| UZ | Uzbekistan | 120200.593 | 2007 |
| UZ | Uzbekistan | 120288.601 | 2006 |
| UZ | Uzbekistan | 117230.323 | 2005 |
| UZ | Uzbekistan | 126071.460 | 2004 |
| UZ | Uzbekistan | 127120.222 | 2003 |
| UZ | Uzbekistan | 128345.000 | 2002 |
| UZ | Uzbekistan | 123442.221 | 2001 |
| UZ | Uzbekistan | 121817.740 | 2000 |
| VU | Vanuatu | 99.009 | 2007 |
| VU | Vanuatu | 47.671 | 2006 |
| VU | Vanuatu | 58.672 | 2005 |
| VU | Vanuatu | 58.672 | 2004 |
| VU | Vanuatu | 84.341 | 2003 |
| VU | Vanuatu | 84.341 | 2002 |
| VU | Vanuatu | 88.008 | 2001 |
| VU | Vanuatu | 84.341 | 2000 |
| VE | Venezuela | 162037.396 | 2007 |
| VE | Venezuela | 170640.178 | 2006 |
| VE | Venezuela | 164380.609 | 2005 |
| VE | Venezuela | 151733.126 | 2004 |
| VE | Venezuela | 192103.129 | 2003 |
| VE | Venezuela | 193316.906 | 2002 |
| VE | Venezuela | 172587.355 | 2001 |
| VE | Venezuela | 152422.522 | 2000 |
| VN | Vietnam | 104872.533 | 2007 |
| VN | Vietnam | 102742.006 | 2006 |
| VN | Vietnam | 98143.588 | 2005 |
| VN | Vietnam | 90549.231 | 2004 |
| VN | Vietnam | 78767.160 | 2003 |
| VN | Vietnam | 70806.103 | 2002 |
| VN | Vietnam | 61139.891 | 2001 |
| VN | Vietnam | 53644.543 | 2000 |
| VI | Virgin Islands (U.S.) | NA | 2007 |
| VI | Virgin Islands (U.S.) | NA | 2006 |
| VI | Virgin Islands (U.S.) | NA | 2005 |
| VI | Virgin Islands (U.S.) | NA | 2004 |
| VI | Virgin Islands (U.S.) | NA | 2003 |
| VI | Virgin Islands (U.S.) | NA | 2002 |
| VI | Virgin Islands (U.S.) | NA | 2001 |
| VI | Virgin Islands (U.S.) | NA | 2000 |
| PS | West Bank and Gaza | 2324.878 | 2007 |
| PS | West Bank and Gaza | 2266.206 | 2006 |
| PS | West Bank and Gaza | 2742.916 | 2005 |
| PS | West Bank and Gaza | 2196.533 | 2004 |
| PS | West Bank and Gaza | 1279.783 | 2003 |
| PS | West Bank and Gaza | 1155.105 | 2002 |
| PS | West Bank and Gaza | 1349.456 | 2001 |
| PS | West Bank and Gaza | 1661.151 | 2000 |
| YE | Yemen | 20971.573 | 2007 |
| YE | Yemen | 21316.271 | 2006 |
| YE | Yemen | 20043.822 | 2005 |
| YE | Yemen | 18881.383 | 2004 |
| YE | Yemen | 17304.573 | 2003 |
| YE | Yemen | 15764.433 | 2002 |
| YE | Yemen | 16208.140 | 2001 |
| YE | Yemen | 14642.331 | 2000 |
| ZM | Zambia | 1928.842 | 2007 |
| ZM | Zambia | 2291.875 | 2006 |
| ZM | Zambia | 2288.208 | 2005 |
| ZM | Zambia | 2145.195 | 2004 |
| ZM | Zambia | 2112.192 | 2003 |
| ZM | Zambia | 1983.847 | 2002 |
| ZM | Zambia | 1906.840 | 2001 |
| ZM | Zambia | 1822.499 | 2000 |
| ZW | Zimbabwe | 9886.232 | 2007 |
| ZW | Zimbabwe | 10447.283 | 2006 |
| ZW | Zimbabwe | 10769.979 | 2005 |
| ZW | Zimbabwe | 9486.529 | 2004 |
| ZW | Zimbabwe | 10656.302 | 2003 |
| ZW | Zimbabwe | 11965.421 | 2002 |
| ZW | Zimbabwe | 12596.145 | 2001 |
| ZW | Zimbabwe | 13923.599 | 2000 |
wide <- pollution%>%
  pivot_wider(names_from = "year",
              values_from = "pollution_qty")

kable(wide)%>%
  kable_styling() %>%
  scroll_box(width = "500px", height = "200px")
| iso2c | ADMIN | 2007 | 2006 | 2005 | 2004 | 2003 | 2002 | 2001 | 2000 |
|---|---|---|---|---|---|---|---|---|---|
| 1A | Arab World | 1360284.651 | 1382459.000 | 1318939.226 | 1253266.923 | 1143443.940 | 1062296.897 | 1040811.944 | 1046627.806 |
| S3 | Caribbean small states | 63805.800 | 62397.672 | 56842.167 | 52496.772 | 50908.961 | 46926.599 | 45797.163 | 42757.220 |
| B8 | Central Europe and the Baltics | 766714.695 | 767063.060 | 741005.358 | 737140.340 | 747022.905 | 723554.105 | 735391.181 | 716124.763 |
| V2 | Early-demographic dividend | 5484214.853 | 5275272.860 | 5002330.716 | 4833667.051 | 4598601.350 | 4370374.604 | 4290070.971 | 4237636.538 |
| Z4 | East Asia & Pacific | 10281497.768 | 10008085.988 | 9362921.050 | 8690370.183 | 7877680.098 | 7120524.831 | 6667667.367 | 6542447.083 |
| 4E | East Asia & Pacific (excluding high income) | 7772136.778 | 7566735.833 | 6929102.534 | 6233173.533 | 5469902.125 | 4725754.582 | 4332445.942 | 4188676.507 |
| T4 | East Asia & Pacific (IDA & IBRD countries) | 7708019.332 | 7489924.507 | 6853645.002 | 6160948.702 | 5399298.134 | 4656704.965 | 4260413.212 | 4119206.817 |
| XC | Euro area | 2705219.240 | 2752534.541 | 2751595.789 | 2766494.810 | 2741848.903 | 2701643.915 | 2702479.991 | 2637185.389 |
| Z7 | Europe & Central Asia | 6985332.291 | 7015318.803 | 6879559.032 | 6875921.212 | 6832819.904 | 6640019.149 | 6652964.745 | 6569031.596 |
| 7E | Europe & Central Asia (excluding high income) | 2941111.747 | 2896398.725 | 2792648.497 | 2772988.495 | 2736197.872 | 2620098.254 | 2604309.368 | 2609943.155 |
| T7 | Europe & Central Asia (IDA & IBRD countries) | 3381468.964 | 3341352.768 | 3214135.479 | 3196694.082 | 3162684.108 | 3033937.682 | 3023070.523 | 3019489.343 |
| EU | European Union | 3475446.921 | 3530492.258 | 3497837.623 | 3516330.304 | 3507327.819 | 3445058.492 | 3451952.452 | 3370336.033 |
| F1 | Fragile and conflict affected situations | 552632.508 | 586257.294 | 596101.985 | 573599.300 | 588448.749 | 556393.569 | 533947.919 | 492324.166 |
| XE | Heavily indebted poor countries (HIPC) | 116881.958 | 109720.307 | 101183.531 | 98649.634 | 91352.304 | 85928.811 | 80343.970 | 77509.379 |
| XD | High income | 13875575.807 | 13800439.207 | 13760173.545 | 13726735.810 | 13510226.570 | 13310449.059 | 13223938.705 | 13262712.366 |
| XF | IBRD only | 15419500.312 | 15023119.614 | 14075502.916 | 13179372.201 | 12204038.125 | 11160923.825 | 10726686.282 | 10516805.477 |
| ZT | IDA & IBRD total | 16109569.753 | 15675953.611 | 14706390.230 | 13800606.979 | 12801637.592 | 11725274.143 | 11278829.534 | 11050716.594 |
| XH | IDA blend | 409732.245 | 396743.731 | 391041.546 | 385959.084 | 374811.404 | 366542.319 | 350382.070 | 340876.689 |
| XI | IDA only | 276066.837 | 251222.886 | 235184.048 | 231207.792 | 219114.622 | 194102.445 | 198644.553 | 189812.677 |
| XG | IDA total | 687626.574 | 650094.046 | 628598.823 | 619529.708 | 596341.035 | 563455.213 | 551425.592 | 533098.835 |
| V3 | Late-demographic dividend | 10920929.642 | 10689357.022 | 9898776.613 | 9134528.562 | 8324075.874 | 7478529.180 | 7110925.021 | 6958306.898 |
| ZJ | Latin America & Caribbean | 1593209.140 | 1567338.855 | 1525959.796 | 1449822.774 | 1440414.044 | 1405994.766 | 1389105.202 | 1357473.558 |
| XJ | Latin America & Caribbean (excluding high income) | 1431736.146 | 1415337.322 | 1383617.772 | 1316618.015 | 1313743.087 | 1284157.731 | 1270197.462 | 1237073.451 |
| T2 | Latin America & the Caribbean (IDA & IBRD countries) | 1536883.704 | 1511086.359 | 1470822.699 | 1396870.310 | 1387200.431 | 1352910.314 | 1337061.540 | 1305257.649 |
| XL | Least developed countries: UN classification | 183973.865 | 173509.872 | 159659.810 | 154129.481 | 132944.182 | 127704.727 | 120565.420 | 111279.094 |
| XO | Low & middle income | 15626291.388 | 15210105.359 | 14271909.444 | 13367216.613 | 12369974.084 | 11309493.439 | 10863207.885 | 10640754.412 |
| XM | Low income | 207668.273 | 201797.578 | 192972.622 | 188872.213 | 184934.460 | 162348.171 | 173828.557 | 169921.065 |
| XN | Lower middle income | 2888209.874 | 2738801.626 | 2640041.982 | 2524293.127 | 2425049.439 | 2306498.996 | 2252498.643 | 2237030.155 |
| ZQ | Middle East & North Africa | 1928724.656 | 1942464.905 | 1834094.054 | 1748161.576 | 1616164.244 | 1516011.140 | 1497085.753 | 1473950.650 |
| XQ | Middle East & North Africa (excluding high income) | 1130037.388 | 1124610.228 | 1088453.608 | 1025139.186 | 966001.477 | 902342.357 | 898961.383 | 873277.715 |
| T3 | Middle East & North Africa (IDA & IBRD countries) | 1127712.510 | 1122344.022 | 1085710.692 | 1022942.653 | 964721.694 | 901187.252 | 897611.927 | 871616.564 |
| XP | Middle income | 15416150.705 | 15005890.983 | 14076763.903 | 13176520.890 | 12183616.422 | 11145668.856 | 10688426.498 | 10469890.979 |
| XU | North America | 6361606.942 | 6269931.942 | 6351735.378 | 6310015.919 | 6229363.921 | 6161201.725 | 6124249.366 | 6228582.850 |
| XY | Not classified | NA | NA | NA | NA | NA | NA | NA | NA |
| OE | OECD members | 13376456.931 | 13279765.475 | 13272160.117 | 13236868.909 | 13094200.607 | 12892508.273 | 12827254.008 | 12879277.737 |
| S4 | Other small states | 162198.729 | 148805.666 | 136444.824 | 124964.308 | 122123.190 | 115501.399 | 113083.562 | 105560.152 |
| S2 | Pacific island small states | 2346.880 | 2310.210 | 2178.198 | 2434.888 | 2148.862 | 1976.513 | 2141.528 | 1877.504 |
| V4 | Post-demographic dividend | 12560523.762 | 12504018.959 | 12563127.332 | 12569936.951 | 12444950.923 | 12270178.036 | 12210578.285 | 12260090.119 |
| V1 | Pre-demographic dividend | 274307.801 | 304832.675 | 320085.825 | 309602.535 | 271176.188 | 261833.355 | 246143.203 | 219227.215 |
| S1 | Small states | 228484.751 | 213653.388 | 195592.051 | 180025.387 | 175298.064 | 164495.945 | 161112.727 | 150277.486 |
| 8S | South Asia | 1629457.119 | 1510701.324 | 1416210.068 | 1340464.516 | 1269654.746 | 1217722.692 | 1197433.181 | 1180858.341 |
| T5 | South Asia (IDA & IBRD) | 1629457.119 | 1510701.324 | 1416210.068 | 1340464.516 | 1269654.746 | 1217722.692 | 1197433.181 | 1180858.341 |
| ZG | Sub-Saharan Africa | 724727.764 | 699333.858 | 666453.953 | 687638.371 | 626728.541 | 573623.106 | 576070.310 | 568106.716 |
| ZF | Sub-Saharan Africa (excluding high income) | 720423.189 | 694993.570 | 662491.939 | 683837.565 | 623140.455 | 570218.855 | 572592.237 | 564864.861 |
| T6 | Sub-Saharan Africa (IDA & IBRD countries) | 724727.764 | 699333.858 | 666453.953 | 687638.371 | 626728.541 | 573623.106 | 576070.310 | 568106.716 |
| XT | Upper middle income | 12527912.269 | 12267101.983 | 11436339.592 | 10651564.747 | 9757431.042 | 8837624.633 | 8434215.393 | 8231009.725 |
| 1W | World | 31033.821 | 30513.107 | 29508.349 | 28356.911 | 27113.798 | 25694.669 | 25085.947 | 24935.600 |
| AF | Afghanistan | 2273.540 | 1650.150 | 1327.454 | 916.750 | 1213.777 | 1070.764 | 817.741 | 773.737 |
| AL | Albania | 3927.357 | 3898.021 | 4253.720 | 4165.712 | 4294.057 | 3751.341 | 3223.293 | 3021.608 |
| DZ | Algeria | 109404.945 | 101069.854 | 107278.085 | 88510.379 | 91575.991 | 89907.506 | 84219.989 | 87861.320 |
| AS | American Samoa | NA | NA | NA | NA | NA | NA | NA | NA |
| AD | Andorra | 539.049 | 546.383 | 575.719 | 561.051 | 535.382 | 531.715 | 524.381 | 524.381 |
| AO | Angola | 25151.953 | 22266.024 | 19156.408 | 18793.375 | 9064.824 | 12665.818 | 9732.218 | 9541.534 |
| AG | Antigua and Barbuda | 469.376 | 443.707 | 429.039 | 421.705 | 403.370 | 370.367 | 348.365 | 344.698 |
| AR | Argentina | 175176.257 | 175436.614 | 162110.736 | 157589.325 | 135062.944 | 124714.670 | 133720.822 | 142136.587 |
| AM | Armenia | 5056.793 | 4378.398 | 4349.062 | 3644.998 | 3428.645 | 3043.610 | 3542.322 | 3465.315 |
| AW | Aruba | 2823.590 | 2717.247 | 2720.914 | 2618.238 | 2563.233 | 2438.555 | 2409.219 | 2379.883 |
| AU | Australia | 372090.490 | 365346.877 | 350172.831 | 342699.485 | 336271.234 | 341353.696 | 324844.862 | 329443.280 |
| AT | Austria | 69419.977 | 71818.195 | 73816.710 | 72140.891 | 71854.865 | 67010.758 | 65877.655 | 62265.660 |
| AZ | Azerbaijan | 30509.440 | 39167.227 | 34337.788 | 32089.917 | 30615.783 | 29614.692 | 28771.282 | 29508.349 |
| BS | The Bahamas | 1796.830 | 1778.495 | 1829.833 | 1972.846 | 1965.512 | 1928.842 | 1870.170 | 1950.844 |
| BH | Bahrain | 26846.107 | 19493.772 | 19878.807 | 17953.632 | 16802.194 | 15889.111 | 14099.615 | 18819.044 |
| BD | Bangladesh | 44539.382 | 43567.627 | 39500.924 | 37682.092 | 35144.528 | 33615.389 | 32621.632 | 27627.178 |
| BB | Barbados | 1360.457 | 1360.457 | 1334.788 | 1279.783 | 1254.114 | 1202.776 | 1188.108 | 1151.438 |
| BY | Belarus | 60523.835 | 62071.309 | 59167.045 | 58158.620 | 53530.866 | 52405.097 | 52760.796 | 53787.556 |
| BE | Belgium | 103658.756 | 107204.745 | 108543.200 | 111102.766 | 112914.264 | 107311.088 | 114527.744 | 115118.131 |
| BZ | Belize | 476.710 | 443.707 | 421.705 | 392.369 | 432.706 | 432.706 | 447.374 | 396.036 |
| BJ | Benin | 4495.742 | 3872.352 | 2394.551 | 2508.228 | 2354.214 | 2079.189 | 1815.165 | 1598.812 |
| BM | Bermuda | 729.733 | 652.726 | 583.053 | 583.053 | 561.051 | 557.384 | 528.048 | 517.047 |
| BT | Bhutan | 392.369 | 392.369 | 396.036 | 308.028 | 377.701 | 418.038 | 385.035 | 396.036 |
| BO | Bolivia | 12332.121 | 15056.702 | 12185.441 | 11114.677 | 11092.675 | 10395.945 | 8621.117 | 11067.006 |
| BA | Bosnia and Herzegovina | 17652.938 | 17564.930 | 16204.473 | 15610.419 | 14488.317 | 14301.300 | 13362.548 | 13787.920 |
| BW | Botswana | 4231.718 | 4136.376 | 4096.039 | 3898.021 | 3828.348 | 3978.695 | 3850.350 | 3780.677 |
| BR | Brazil | 363212.683 | 347668.270 | 347308.904 | 337826.042 | 321621.569 | 332266.870 | 337433.673 | 327983.814 |
| VG | British Virgin Islands | 187.017 | 183.350 | 179.683 | 161.348 | 146.680 | 135.679 | 128.345 | 124.678 |
| BN | Brunei Darussalam | 8415.765 | 4862.442 | 5005.455 | 4998.121 | 4591.084 | 4378.398 | 4506.743 | 4712.095 |
| BG | Bulgaria | 52254.750 | 48991.120 | 47916.689 | 46801.921 | 47307.967 | 44634.724 | 46453.556 | 43530.957 |
| BF | Burkina Faso | 1595.145 | 1360.457 | 1125.769 | 1103.767 | 1078.098 | 1004.758 | 997.424 | 1041.428 |
| BI | Burundi | 187.017 | 187.017 | 154.014 | 198.018 | 161.348 | 212.686 | 205.352 | 271.358 |
| CV | Cabo Verde | 506.046 | 473.043 | 440.040 | 330.030 | 308.028 | 275.025 | 234.688 | 216.353 |
| KH | Cambodia | 3465.315 | 2999.606 | 2775.919 | 2445.889 | 2379.883 | 2207.534 | 2251.538 | 1976.513 |
| CM | Cameroon | 5834.197 | 3861.351 | 3696.336 | 3956.693 | 3795.345 | 3417.644 | 3421.311 | 3432.312 |
| CA | Canada | 571846.648 | 571993.328 | 561425.034 | 553357.634 | 553100.944 | 519335.208 | 527926.989 | 534380.909 |
| KY | Cayman Islands | 572.052 | 484.044 | 473.043 | 462.042 | 484.044 | 484.044 | 465.709 | 465.709 |
| CF | Central African Republic | 253.023 | 249.356 | 234.688 | 234.688 | 234.688 | 245.689 | 245.689 | 267.691 |
| TD | Chad | 854.411 | 792.072 | 766.403 | 748.068 | 744.401 | 509.713 | 502.379 | 487.711 |
| JG | Channel Islands | NA | NA | NA | NA | NA | NA | NA | NA |
| CL | Chile | 71638.512 | 64814.225 | 61818.286 | 59775.767 | 55602.721 | 55162.681 | 53340.182 | 58815.013 |
| CN | China | 6697654.489 | 6529291.518 | 5896957.705 | 5233538.733 | 4540417.061 | 3850269.326 | 3487566.356 | 3405179.867 |
| CO | Colombia | 62430.675 | 62940.388 | 60945.540 | 55071.006 | 57421.553 | 55661.393 | 56273.782 | 57923.932 |
| KM | Comoros | 102.676 | 161.348 | 139.346 | 143.013 | 132.012 | 102.676 | 102.676 | 102.676 |
| CD | Democratic Republic of the Congo | 1756.493 | 1609.813 | 1499.803 | 1191.775 | 1070.764 | 876.413 | 788.405 | 909.416 |
| CG | Republic of the Congo | 1213.777 | 1118.435 | 982.756 | 949.753 | 916.750 | 575.719 | 766.403 | 1048.762 |
| CR | Costa Rica | 8122.405 | 7099.312 | 6868.291 | 6930.630 | 6626.269 | 6325.575 | 5760.857 | 5474.831 |
| CI | Cote d’Ivoire | 6776.616 | 6996.636 | 7825.378 | 7664.030 | 5460.163 | 7286.329 | 7726.369 | 6791.284 |
| HR | Croatia | 23828.166 | 22607.055 | 22592.387 | 22376.034 | 22984.756 | 21473.952 | 20395.854 | 19339.758 |
| CU | Cuba | 25958.693 | 26505.076 | 26006.364 | 25005.273 | 25485.650 | 26090.705 | 25452.647 | 26083.371 |
| CW | Curacao | NA | NA | NA | NA | NA | NA | NA | NA |
| CY | Cyprus | 8195.745 | 7788.708 | 7502.682 | 7334.000 | 7748.371 | 7022.305 | 6882.959 | 6978.301 |
| CZ | Czechia | 123288.207 | 122092.765 | 120094.250 | 116757.280 | 122037.760 | 119694.547 | 123684.243 | 123801.587 |
| DK | Denmark | 50318.574 | 55019.668 | 47062.278 | 50600.933 | 55998.757 | 52049.398 | 52918.477 | 51330.666 |
| DJ | Djibouti | 462.042 | 410.704 | 414.371 | 407.037 | 421.705 | 399.703 | 366.700 | 366.700 |
| DM | Dominica | 183.350 | 143.013 | 143.013 | 143.013 | 117.344 | 102.676 | 110.010 | 102.676 |
| DO | Dominican Republic | 21173.258 | 19783.465 | 18639.361 | 18309.331 | 21514.289 | 21330.939 | 19816.468 | 19790.799 |
| EC | Ecuador | 31924.902 | 28859.290 | 30263.751 | 29046.307 | 26967.118 | 24950.268 | 23116.768 | 20718.550 |
| EG | Egypt | 189092.522 | 178586.567 | 167207.866 | 150911.718 | 147963.450 | 127193.562 | 125451.737 | 141326.180 |
| SV | El Salvador | 6978.301 | 6842.622 | 6402.582 | 6365.912 | 6552.929 | 6182.562 | 5951.541 | 5753.523 |
| GQ | Equatorial Guinea | 7865.715 | 8181.077 | 7532.018 | 7058.975 | 7693.366 | 6354.911 | 4334.394 | 458.375 |
| ER | Eritrea | 564.718 | 550.050 | 766.403 | 770.070 | 715.065 | 605.055 | 630.724 | 608.722 |
| EE | Estonia | 18357.002 | 16175.137 | 16754.523 | 17282.571 | 17124.890 | 14888.020 | 15570.082 | 14858.684 |
| SZ | Eswatini | 1078.098 | 1030.427 | 1030.427 | 1041.428 | 1048.762 | 1133.103 | 1147.771 | 1191.775 |
| ET | Ethiopia | 6024.881 | 5504.167 | 5119.132 | 5295.148 | 4987.120 | 4521.411 | 4352.729 | 3549.656 |
| FO | Faroe Islands | 689.396 | 678.395 | 722.399 | 748.068 | 733.400 | 726.066 | 762.736 | 689.396 |
| FJ | Fiji | 1158.772 | 1217.444 | 1096.433 | 1353.123 | 1048.762 | 891.081 | 1056.096 | 843.410 |
| FI | Finland | 63739.794 | 65774.979 | 54777.646 | 67186.774 | 68671.909 | 61348.910 | 56552.474 | 52196.078 |
| FR | France | 369142.222 | 375764.824 | 385368.697 | 383758.884 | 380689.605 | 375075.428 | 377535.985 | 362226.260 |
| PF | French Polynesia | 766.403 | 781.071 | 781.071 | 726.066 | 737.067 | 682.062 | 678.395 | 568.385 |
| GA | Gabon | 4118.041 | 4173.046 | 4888.111 | 4686.426 | 4642.422 | 4572.749 | 4800.103 | 4693.760 |
| GM | Gambia, The | 352.032 | 352.032 | 326.363 | 322.696 | 300.694 | 300.694 | 300.694 | 275.025 |
| GE | Georgia | 6420.917 | 6149.559 | 5067.794 | 4323.393 | 3773.343 | 3388.308 | 3769.676 | 4536.079 |
| DE | Germany | 781247.016 | 816721.574 | 797759.517 | 815969.839 | 823003.145 | 829724.756 | 853662.932 | 829977.779 |
| GH | Ghana | 9827.560 | 9358.184 | 6992.969 | 7348.668 | 7631.027 | 7422.008 | 6919.629 | 6288.905 |
| GI | Gibraltar | 414.371 | 418.038 | 399.703 | 385.035 | 355.699 | 348.365 | 344.698 | 333.697 |
| GR | Greece | 98246.264 | 97285.510 | 98675.303 | 97149.831 | 95738.036 | 93669.848 | 93805.527 | 91616.328 |
| GL | Greenland | 638.058 | 627.057 | 608.722 | 583.053 | 429.039 | 377.701 | 407.037 | 454.708 |
| GD | Grenada | 238.355 | 231.021 | 216.353 | 205.352 | 216.353 | 205.352 | 194.351 | 190.684 |
| GU | Guam | NA | NA | NA | NA | NA | NA | NA | NA |
| GT | Guatemala | 12398.127 | 12405.461 | 12328.454 | 11375.034 | 10619.632 | 10887.323 | 10392.278 | 9915.568 |
| GN | Guinea | 1969.179 | 1892.172 | 1826.166 | 1943.510 | 1881.171 | 1804.164 | 1719.823 | 1642.816 |
| GW | Guinea-Bissau | 231.021 | 216.353 | 212.686 | 201.685 | 194.351 | 154.014 | 150.347 | 146.680 |
| GY | Guyana | 1562.142 | 1290.784 | 1437.464 | 1628.148 | 1565.809 | 1580.477 | 1595.145 | 1609.813 |
| HT | Haiti | 2390.884 | 2112.192 | 2075.522 | 1987.514 | 1734.491 | 1826.166 | 1569.476 | 1342.122 |
| HN | Honduras | 8778.798 | 7620.026 | 7554.020 | 7367.003 | 6769.282 | 6090.887 | 5713.186 | 5031.124 |
| HK | Hong Kong SAR, China | 43721.641 | 42056.823 | 43871.988 | 41708.458 | 43358.608 | 39636.603 | 37957.117 | 40439.676 |
| HU | Hungary | 55980.422 | 57384.883 | 58019.274 | 57458.223 | 59053.368 | 56064.763 | 56977.846 | 55826.408 |
| IS | Iceland | 2310.210 | 2299.209 | 2229.536 | 2244.204 | 2167.197 | 2170.864 | 2101.191 | 2163.530 |
| IN | India | 1407607.286 | 1303717.509 | 1222563.132 | 1154320.262 | 1099597.621 | 1054258.833 | 1041152.975 | 1031853.463 |
| ID | Indonesia | 375544.804 | 345119.705 | 341991.754 | 337635.358 | 316792.130 | 306737.216 | 294907.474 | 263418.945 |
| IR | Iran | 519324.207 | 509338.966 | 468807.615 | 447036.636 | 418437.703 | 401760.187 | 398437.885 | 372237.170 |
| IQ | Iraq | 62155.650 | 98770.645 | 113522.986 | 114084.037 | 91117.616 | 87259.932 | 85342.091 | 72445.252 |
| IE | Ireland | 44469.709 | 43145.922 | 43464.951 | 43761.978 | 42687.547 | 43413.613 | 44029.669 | 41228.081 |
| IM | Isle of Man | NA | NA | NA | NA | NA | NA | NA | NA |
| IL | Israel | 63072.400 | 62471.012 | 56952.177 | 59020.365 | 62889.050 | 59812.437 | 63596.781 | 60259.811 |
| IT | Italy | 462676.391 | 469346.664 | 473384.031 | 473970.751 | 468349.240 | 452610.476 | 450347.937 | 450564.290 |
| JM | Jamaica | 9651.544 | 11496.045 | 10498.621 | 10670.970 | 10667.303 | 10241.931 | 10615.965 | 10307.937 |
| JP | Japan | 1251554.434 | 1234755.907 | 1240945.803 | 1262394.086 | 1240953.137 | 1218980.473 | 1201331.202 | 1219281.167 |
| JO | Jordan | 22035.003 | 21121.920 | 21059.581 | 19240.749 | 17469.588 | 16886.535 | 16002.788 | 15507.743 |
| KZ | Kazakhstan | 222348.545 | 192631.177 | 177328.786 | 173053.064 | 142209.927 | 133735.490 | 131850.652 | 118099.402 |
| KE | Kenya | 9831.227 | 9574.537 | 8562.445 | 7623.693 | 6754.614 | 7968.391 | 9369.185 | 10417.947 |
| KI | Kiribati | 58.672 | 66.006 | 58.672 | 47.671 | 44.004 | 40.337 | 29.336 | 33.003 |
| KP | North Korea | 64227.505 | 76900.657 | 75573.203 | 72357.244 | 70751.098 | 69225.626 | 72225.232 | 69661.999 |
| KR | South Korea | 495675.724 | 470655.783 | 462918.413 | 482276.506 | 466215.046 | 465631.993 | 450193.923 | 447561.017 |
| XK | Kosovo | NA | NA | NA | NA | NA | NA | NA | NA |
| KW | Kuwait | 75235.839 | 73769.039 | 71546.837 | 63534.442 | 59922.447 | 58228.293 | 57641.573 | 53560.202 |
| KG | Kyrgyzstan | 6629.936 | 5507.834 | 5592.175 | 5874.534 | 5438.161 | 4957.784 | 3894.354 | 4635.088 |
| LA | Lao PDR | 1877.504 | 1796.830 | 1364.124 | 1305.452 | 1243.113 | 1188.108 | 1070.764 | 968.088 |
| LV | Latvia | 8316.756 | 8012.395 | 7506.349 | 7403.673 | 7370.670 | 6912.295 | 6985.635 | 6351.244 |
| LB | Lebanon | 13461.557 | 14458.981 | 16208.140 | 16798.527 | 18180.986 | 16002.788 | 16171.470 | 15247.386 |
| LS | Lesotho | 2075.522 | 2038.852 | 2013.183 | 1983.847 | 1932.509 | 1906.840 | 1877.504 | 1851.835 |
| LR | Liberia | 645.392 | 689.396 | 671.061 | 557.384 | 469.376 | 440.040 | 454.708 | 429.039 |
| LY | Libya | 49959.208 | 53270.509 | 52108.070 | 50358.911 | 49167.136 | 47832.348 | 48100.039 | 47113.616 |
| LI | Liechtenstein | 69.673 | NA | NA | NA | NA | NA | NA | NA |
| LT | Lithuania | 15166.712 | 14158.287 | 13901.597 | 13245.204 | 12823.499 | 13142.528 | 12885.838 | 12163.439 |
| LU | Luxembourg | 11019.335 | 11349.365 | 11547.383 | 11268.691 | 9904.567 | 9416.856 | 8800.800 | 8239.749 |
| MO | Macao SAR, China | 1364.124 | 1620.814 | 1829.833 | 1716.156 | 1532.806 | 1518.138 | 1686.820 | 1631.815 |
| MG | Madagascar | 1815.165 | 1683.153 | 1741.825 | 1807.831 | 1701.488 | 1235.779 | 1741.825 | 1873.837 |
| MW | Malawi | 990.090 | 938.752 | 924.084 | 924.084 | 920.417 | 858.078 | 810.407 | 880.080 |
| MY | Malaysia | 184816.800 | 180108.372 | 183188.652 | 171879.624 | 158256.719 | 136449.070 | 135620.328 | 125734.096 |
| MV | Maldives | 781.071 | 759.069 | 601.388 | 667.394 | 506.046 | 594.054 | 462.042 | 451.041 |
| ML | Mali | 1298.118 | 1081.765 | 916.750 | 891.081 | 858.078 | 858.078 | 839.743 | 832.409 |
| MT | Malta | 2724.581 | 2574.234 | 2698.912 | 2574.234 | 2581.568 | 2299.209 | 2486.226 | 2115.859 |
| MH | Marshall Islands | 124.678 | 121.011 | 113.677 | 117.344 | 106.343 | 110.010 | 102.676 | 99.009 |
| MR | Mauritania | 1844.501 | 1609.813 | 1587.811 | 1536.473 | 1389.793 | 1349.456 | 1272.449 | 1173.440 |
| MU | Mauritius | 3689.002 | 3630.330 | 3296.633 | 3091.281 | 3061.945 | 2885.929 | 2863.927 | 2691.578 |
| MX | Mexico | 480520.013 | 479251.231 | 466361.726 | 441308.782 | 440208.682 | 414389.335 | 412977.540 | 398382.880 |
| FM | Micronesia, Fed. Sts. | 132.012 | 121.011 | 121.011 | 143.013 | 143.013 | 143.013 | 168.682 | 124.678 |
| MD | Moldova | 4679.092 | 4994.454 | 4895.445 | 4554.414 | 4290.390 | 3986.029 | 3714.671 | 3512.986 |
| MC | Monaco | NA | NA | NA | NA | NA | NA | NA | NA |
| MN | Mongolia | 12064.430 | 9394.854 | 8562.445 | 8551.444 | 8034.397 | 8287.420 | 7884.050 | 7506.349 |
| ME | Montenegro | 2057.187 | 2064.521 | 2057.187 | NA | NA | NA | NA | NA |
| MA | Morocco | 50267.236 | 47425.311 | 45771.494 | 43310.937 | 37561.081 | 38254.144 | 37715.095 | 33905.082 |
| MZ | Mozambique | 2262.539 | 1980.180 | 1822.499 | 1921.508 | 1917.841 | 1587.811 | 1580.477 | 1349.456 |
| MM | Myanmar | 12874.837 | 12852.835 | 11595.054 | 12434.797 | 9845.895 | 9207.837 | 8723.793 | 10087.917 |
| NA | Namibia | 2361.548 | 2332.212 | 2310.210 | 1961.845 | 1873.837 | 1760.160 | 2016.850 | 1642.816 |
| NR | Nauru | 44.004 | 44.004 | 62.339 | 66.006 | 66.006 | 77.007 | 80.674 | 84.341 |
| NP | Nepal | 2614.571 | 2563.233 | 3083.947 | 2669.576 | 2841.925 | 2625.572 | 3267.297 | 3069.279 |
| NL | Netherlands | 177427.795 | 180211.048 | 181927.204 | 185275.175 | 183067.641 | 181817.194 | 177420.461 | 173837.802 |
| NC | New Caledonia | 2944.601 | 2720.914 | 2823.590 | 2530.230 | 2739.249 | 2405.552 | 1888.505 | 2233.203 |
| NZ | New Zealand | 33637.391 | 33446.707 | 34139.770 | 34554.141 | 34081.098 | 33201.018 | 34447.798 | 32980.998 |
| NI | Nicaragua | 4605.752 | 4470.073 | 4319.726 | 4426.069 | 4411.401 | 4037.367 | 3964.027 | 3762.342 |
| NE | Niger | 722.399 | 693.063 | 715.065 | 814.074 | 759.069 | 700.397 | 656.393 | 696.730 |
| NG | Nigeria | 94868.957 | 98238.930 | 106119.313 | 98997.999 | 100318.119 | 94586.598 | 87017.910 | 79122.859 |
| MK | North Macedonia | 9493.863 | 10938.661 | 11279.692 | 11191.684 | 11309.028 | 10934.994 | 11998.424 | 12064.430 |
| MP | Northern Mariana Islands | NA | NA | NA | NA | NA | NA | NA | NA |
| NO | Norway | 45089.432 | 44257.023 | 42438.191 | 42647.210 | 45221.444 | 38023.123 | 41910.143 | 39673.273 |
| OM | Oman | 44198.351 | 39603.600 | 29893.384 | 27986.544 | 32390.611 | 25470.982 | 20285.844 | 21690.305 |
| PK | Pakistan | 158894.777 | 146074.945 | 136636.087 | 131601.296 | 118895.141 | 114084.037 | 108282.843 | 106449.343 |
| PW | Palau | 253.023 | 227.354 | 220.020 | 216.353 | 212.686 | 212.686 | 216.353 | 209.019 |
| PA | Panama | 7304.664 | 7469.679 | 6838.955 | 5804.861 | 6153.226 | 5870.867 | 7007.637 | 5790.193 |
| PG | Papua New Guinea | 6120.223 | 4308.725 | 4385.732 | 4488.408 | 3945.692 | 3487.317 | 3208.625 | 2665.909 |
| PY | Paraguay | 4136.376 | 3986.029 | 3832.015 | 4088.705 | 4070.370 | 3898.021 | 3821.014 | 3689.002 |
| PE | Peru | 35071.188 | 28723.611 | 37135.709 | 31895.566 | 26380.398 | 27187.138 | 27165.136 | 30296.754 |
| PH | Philippines | 72170.227 | 67692.820 | 74832.469 | 74066.066 | 71425.826 | 71337.818 | 71051.792 | 73306.997 |
| PL | Poland | 314272.901 | 318940.992 | 302538.501 | 304416.005 | 302252.475 | 294834.134 | 301284.387 | 299289.539 |
| PT | Portugal | 60149.801 | 59816.104 | 65279.934 | 63145.740 | 61216.898 | 66790.738 | 62757.038 | 62731.369 |
| PR | Puerto Rico | NA | NA | NA | NA | NA | NA | NA | NA |
| QA | Qatar | 63277.752 | 63475.770 | 50956.632 | 42944.237 | 41521.441 | 40905.385 | 41396.763 | 34730.157 |
| RO | Romania | 102224.959 | 103350.728 | 96456.768 | 96904.142 | 101062.520 | 97237.839 | 96632.784 | 90681.243 |
| RU | Russia | 1666886.188 | 1669262.404 | 1615089.813 | 1602115.967 | 1604242.827 | 1557085.207 | 1557506.912 | 1557899.281 |
| RW | Rwanda | 557.384 | 528.048 | 528.048 | 528.048 | 520.714 | 531.715 | 531.715 | 528.048 |
| WS | Samoa | 172.349 | 165.015 | 161.348 | 150.347 | 154.014 | 146.680 | 146.680 | 143.013 |
| SM | San Marino | NA | NA | NA | NA | NA | NA | NA | NA |
| ST | Sao Tome and Principe | 84.341 | 84.341 | 77.007 | 73.340 | 66.006 | 58.672 | 51.338 | 47.671 |
| SA | Saudi Arabia | 387777.916 | 432739.003 | 397642.146 | 395834.315 | 327272.416 | 326407.004 | 297214.017 | 296935.325 |
| SN | Senegal | 5181.471 | 4730.430 | 5812.195 | 5232.809 | 4976.119 | 4510.410 | 4330.727 | 3938.358 |
| RS | Republic of Serbia | 59805.103 | 61066.551 | NA | NA | NA | NA | NA | NA |
| SC | Seychelles | 641.725 | 733.400 | 689.396 | 737.067 | 550.050 | 539.049 | 634.391 | 572.052 |
| SL | Sierra Leone | 641.725 | 733.400 | 546.383 | 641.725 | 652.726 | 608.722 | 568.385 | 425.372 |
| SG | Singapore | 19926.478 | 30799.133 | 30359.093 | 28474.255 | 31132.830 | 47230.960 | 49541.170 | 49005.788 |
| SX | Sint Maarten (Dutch part) | NA | NA | NA | NA | NA | NA | NA | NA |
| SK | Slovakia | 36780.010 | 39104.888 | 39357.911 | 38749.189 | 39493.590 | 39251.568 | 39357.911 | 35885.262 |
| SI | Slovenia | 16244.810 | 16244.810 | 15867.109 | 15746.098 | 15511.410 | 15419.735 | 15163.045 | 14396.642 |
| SB | Solomon Islands | 179.683 | 165.015 | 161.348 | 161.348 | 161.348 | 157.681 | 157.681 | 154.014 |
| SO | Somalia | 608.722 | 594.054 | 594.054 | 594.054 | 594.054 | 586.720 | 502.379 | 480.377 |
| ZA | South Africa | 466578.079 | 447894.714 | 416915.898 | 450186.589 | 404459.099 | 356637.752 | 372042.819 | 378665.421 |
| SS | South Sudan | NA | NA | NA | NA | NA | NA | NA | NA |
| ES | Spain | 358236.564 | 350037.152 | 353462.130 | 339428.521 | 321097.188 | 314518.590 | 297830.073 | 294434.431 |
| LK | Sri Lanka | 12354.123 | 11976.422 | 12101.100 | 12299.118 | 11078.007 | 11056.005 | 10443.616 | 10238.264 |
| KN | St. Kitts and Nevis | 216.353 | 201.685 | 198.018 | 212.686 | 198.018 | 198.018 | 176.016 | 172.349 |
| LC | St. Lucia | 385.035 | 366.700 | 366.700 | 355.699 | 359.366 | 289.693 | 348.365 | 348.365 |
| MF | St. Martin (French part) | NA | NA | NA | NA | NA | NA | NA | NA |
| VC | St. Vincent and the Grenadines | 227.354 | 220.020 | 220.020 | 220.020 | 198.018 | 187.017 | 179.683 | 146.680 |
| SD | Sudan | 14125.284 | 12013.092 | 10982.665 | 11463.042 | 9072.158 | 8118.738 | 6369.579 | 5533.503 |
| SR | Suriname | 1763.827 | 1745.492 | 1595.145 | 1562.142 | 1543.807 | 1565.809 | 2368.882 | 2196.533 |
| SE | Sweden | 48059.702 | 49570.506 | 51561.687 | 54520.956 | 54781.313 | 57425.220 | 51125.314 | 49350.486 |
| CH | Switzerland | 38107.464 | 41994.484 | 41444.434 | 40443.343 | 40193.987 | 40758.705 | 42984.574 | 39101.221 |
| SY | Syria | 66468.042 | 53582.204 | 50626.602 | 51103.312 | 54275.267 | 39064.551 | 48778.434 | 51040.973 |
| TJ | Tajikistan | 3234.294 | 2658.575 | 2442.222 | 2563.233 | 2075.522 | 1881.171 | 2291.875 | 2236.870 |
| TZ | United Republic of Tanzania | 5896.536 | 6028.548 | 5504.167 | 4363.730 | 3806.346 | 3589.993 | 3127.951 | 2651.241 |
| TH | Thailand | 234027.940 | 231127.343 | 227493.346 | 221442.796 | 205880.048 | 194589.355 | 184699.456 | 172697.365 |
| TL | East Timor | 183.350 | 179.683 | 176.016 | 176.016 | 161.348 | 161.348 | NA | NA |
| TG | Togo | 1408.128 | 1221.111 | 1338.455 | 1397.127 | 1463.133 | 1232.112 | 1162.439 | 1360.457 |
| TO | Tonga | 113.677 | 128.345 | 113.677 | 110.010 | 117.344 | 102.676 | 88.008 | 95.342 |
| TT | Trinidad and Tobago | 45474.467 | 42676.546 | 38151.468 | 33432.039 | 31987.241 | 28620.935 | 26354.729 | 23839.167 |
| TN | Tunisia | 24110.525 | 22992.090 | 22662.060 | 22299.027 | 21246.598 | 20861.563 | 20817.559 | 19922.811 |
| TR | Turkey | 284808.556 | 261614.781 | 237390.579 | 225421.491 | 218523.864 | 205685.697 | 194567.353 | 216151.315 |
| TM | Turkmenistan | 56042.761 | 49511.834 | 48338.394 | 46541.564 | 44601.721 | 39966.633 | 38074.461 | 37539.079 |
| TC | Turks and Caicos Islands | 165.015 | 143.013 | 121.011 | 102.676 | 102.676 | 99.009 | 73.340 | 69.673 |
| TV | Tuvalu | 11.001 | 7.334 | 11.001 | 11.001 | 11.001 | 11.001 | 7.334 | 7.334 |
| UG | Uganda | 2889.596 | 2537.564 | 2170.864 | 1738.158 | 1628.148 | 1558.475 | 1510.804 | 1437.464 |
| UA | Ukraine | 321258.536 | 326429.006 | 333876.683 | 343396.215 | 352431.703 | 318687.969 | 321775.583 | 320902.837 |
| AE | United Arab Emirates | 135554.322 | 123728.247 | 116071.551 | 113174.621 | 106783.040 | 84656.362 | 101403.551 | 112562.232 |
| GB | United Kingdom | 528425.701 | 541458.219 | 542580.321 | 539239.684 | 540006.087 | 528642.054 | 545862.286 | 541784.582 |
| US | United States of America | 5789030.561 | 5697285.888 | 5789727.291 | 5756075.232 | 5675701.926 | 5641309.133 | 5595794.329 | 5693684.894 |
| UY | Uruguay | 6002.879 | 6648.271 | 5775.525 | 5610.510 | 4598.418 | 4620.420 | 5089.796 | 5306.149 |
| UZ | Uzbekistan | 120200.593 | 120288.601 | 117230.323 | 126071.460 | 127120.222 | 128345.000 | 123442.221 | 121817.740 |
| VU | Vanuatu | 99.009 | 47.671 | 58.672 | 58.672 | 84.341 | 84.341 | 88.008 | 84.341 |
| VE | Venezuela | 162037.396 | 170640.178 | 164380.609 | 151733.126 | 192103.129 | 193316.906 | 172587.355 | 152422.522 |
| VN | Vietnam | 104872.533 | 102742.006 | 98143.588 | 90549.231 | 78767.160 | 70806.103 | 61139.891 | 53644.543 |
| VI | Virgin Islands (U.S.) | NA | NA | NA | NA | NA | NA | NA | NA |
| PS | West Bank and Gaza | 2324.878 | 2266.206 | 2742.916 | 2196.533 | 1279.783 | 1155.105 | 1349.456 | 1661.151 |
| YE | Yemen | 20971.573 | 21316.271 | 20043.822 | 18881.383 | 17304.573 | 15764.433 | 16208.140 | 14642.331 |
| ZM | Zambia | 1928.842 | 2291.875 | 2288.208 | 2145.195 | 2112.192 | 1983.847 | 1906.840 | 1822.499 |
| ZW | Zimbabwe | 9886.232 | 10447.283 | 10769.979 | 9486.529 | 10656.302 | 11965.421 | 12596.145 | 13923.599 |
Sources