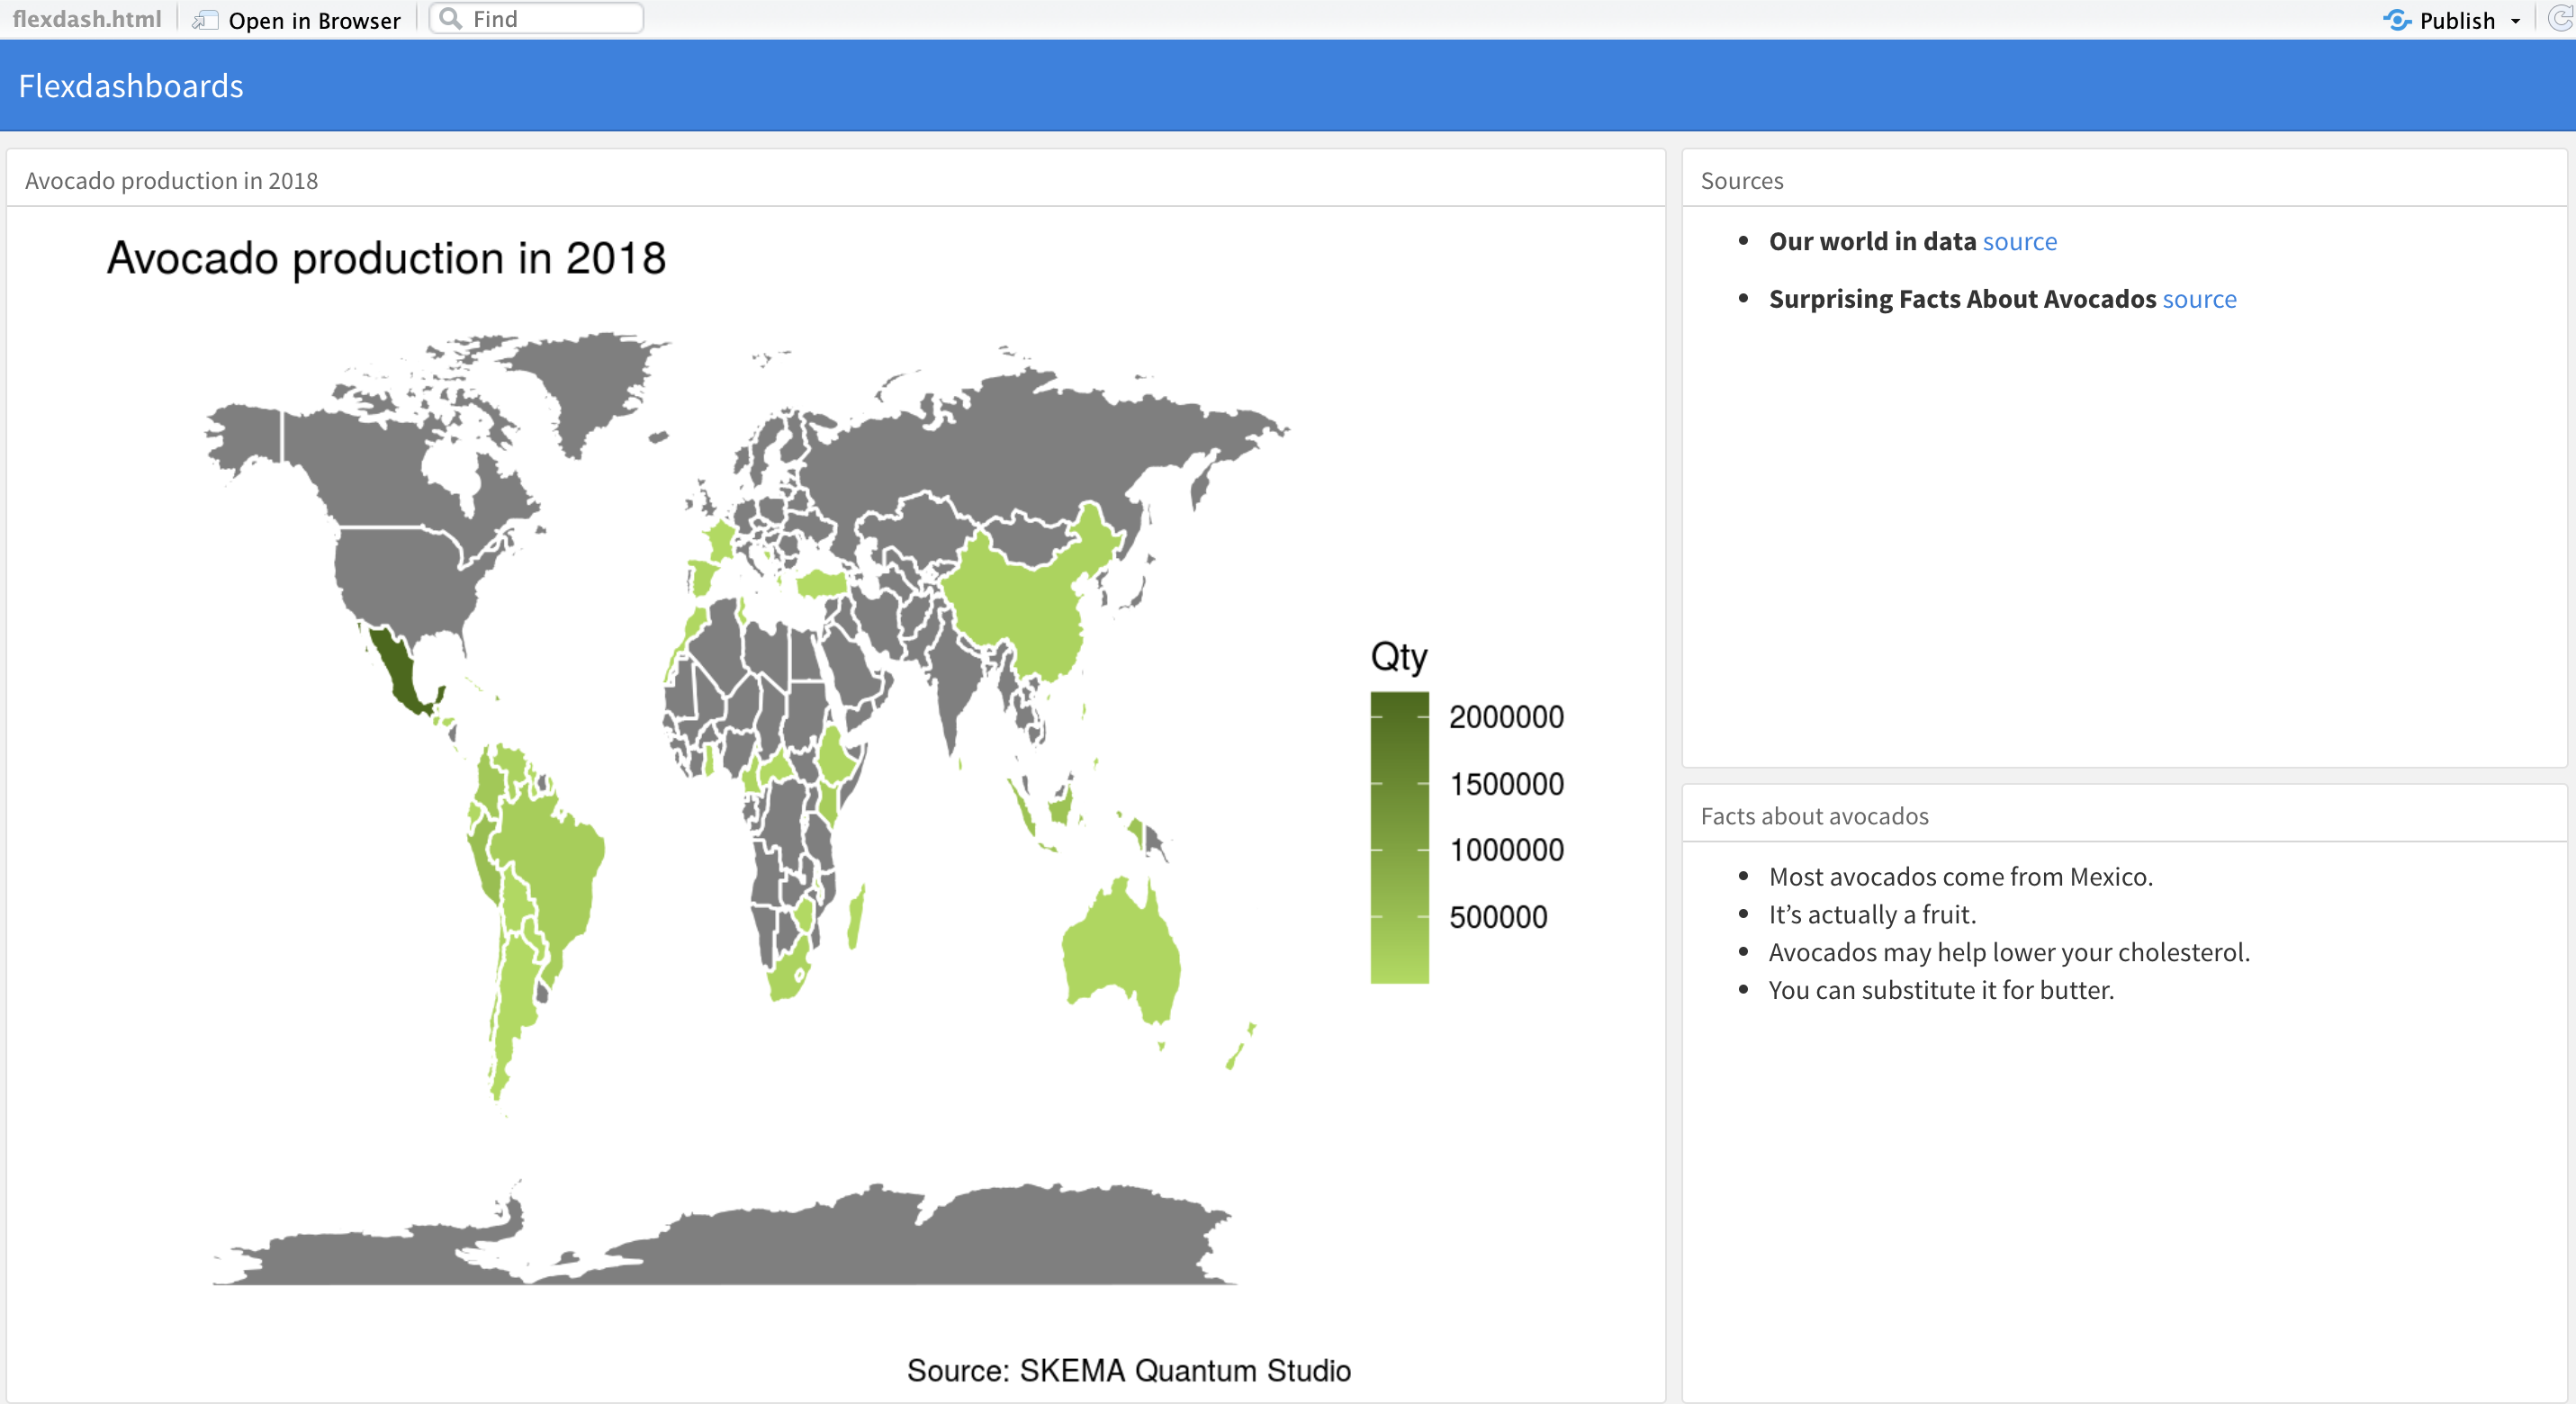
Nüance-R has made available the flexdashboard output. You will be able to publish groups of related data visualizations as a dashboard. Take a look at this example!
Get started
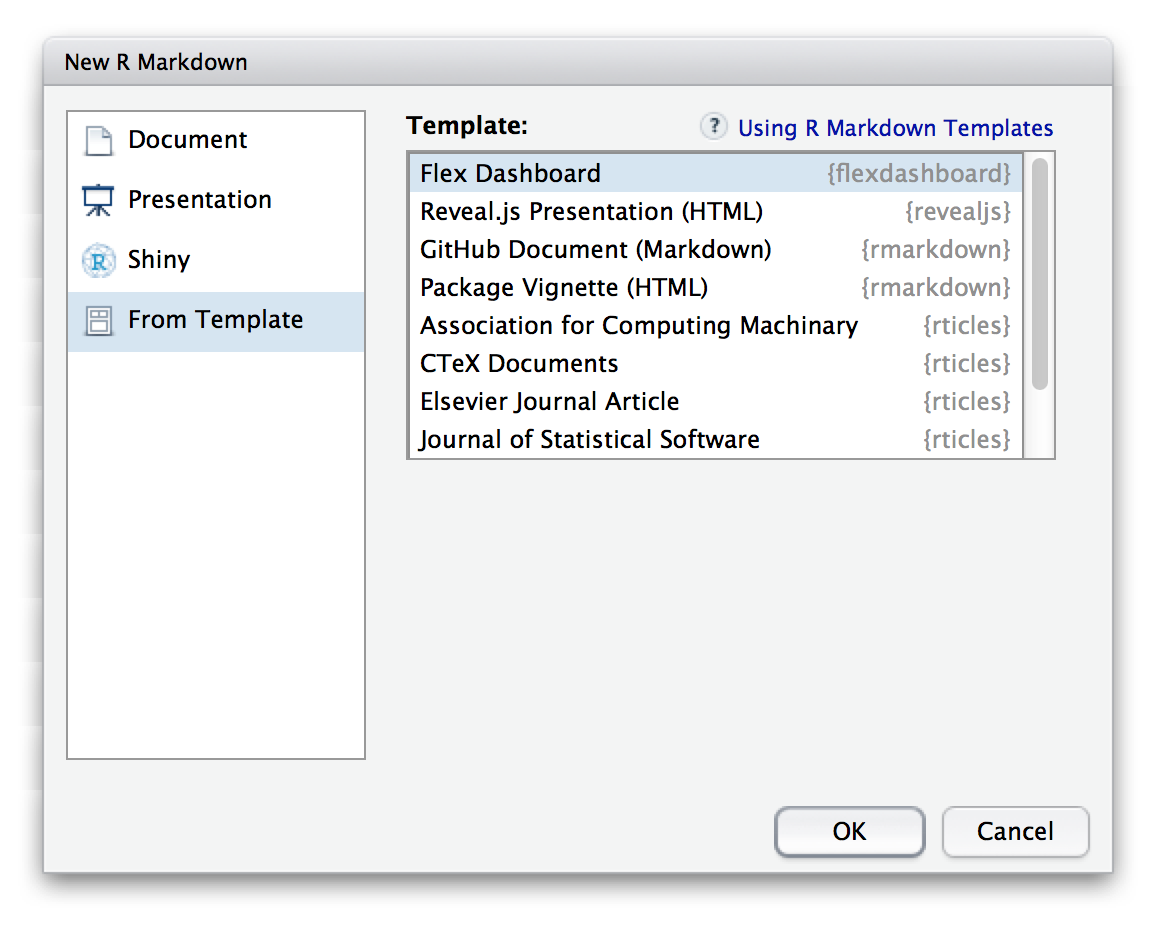
To author a flexdashboard you create an R Markdown document with the flexdashboard::flex_dashboard output format. You can do this from within RStudio using the New R Markdown dialog:

Example
Column {data-width=650}
-----------------------------------------------------------------------

### Avocado production in 2018

```{r}
library(maps)
library(ggplot2)
library(dplyr)
library(readr)
library(rgdal)
library(sp)
library(stringr)
library(tidyverse)
library(broom)

avocado <- read.csv("avocado-production.csv", header = TRUE)

avocado2018 <- filter(avocado, Year == "2018")

worldgood <- map_data("world")

names(avocado2018)[names(avocado2018) == "Entity"] <- "region"

names(avocado2018)[names(avocado2018) ==
                     "Crops...Avocados...572...Production...5510...tonnes..tonnes."] <- "Qty"

avocado2018$region <- as.character(avocado2018$region)

AvocadoFinal <- left_join(worldgood, avocado2018, by = "region")

ggplot(data = AvocadoFinal, aes(x = long, y = lat, group = group, fill = Qty)) +
  theme_void() +
  theme(legend.position = "right") +
  geom_polygon(color = "white", size = 0.5) +
  scale_fill_continuous(high = "#436906", low = "#A6DC4C") +
  labs(title = "Avocado production in 2018",
        caption = "Source: Nüance-R")
```

Column {data-width=350}
-----------------------------------------------------------------------

### Sources

- **Our world in data**
[source](https://ourworldindata.org/grapher/avocado-production)

- **Surprising Facts About Avocados**
[source](https://www.tasteofhome.com/article/13-surprising-facts-about-avocados/)


### Facts about avocados

- Most avocados come from Mexico.
- It’s actually a fruit.
- Avocados may help lower your cholesterol.
- You can substitute it for butter.

Sources
flexdashboard: Easy interactive dashboards for R - RStudio