Database description
The yearly IRI Scoreboard for company-level data on innovation lists Research and Development investments made by the world’s 1,000 top investor companies. This scientific project is carried out within the Directorate B of Growth and Innovation, one of the seven scientific institutes of the European Commission’s Joint Research Centre (JRC).
The IRI Scoreboard aims at providing robust data and analyses on the contribution of private-sector R&D to sustainable competitiveness and “prosperity”. With iriR, we want to make the IRI Scoreboard’s data readily available. We have also compiled the yearly scoreboards through time to create a cross-section time-series dataset. Researchers and analysts have access to more than 7,500 innovative companies worldwide, which are or have been part of the top 1,000 innovative companies.
Functions
This package lets you recreate impactful dashboards and visualizations as the ones found on the Social Progress Imperative. This API provides one main function, irir_data(), which lets you extract the data in a convenient format and four other functions, irir_country(), irir_indicator(), irir_industry() and irir_company() that can assist you finding the appropriate arguments for the API. The API includes also a function to produce visuals irir_visual().
- irir_country()
- irir_indicator()
- irir_industry()
- irir_company()
- irir_data()
- irir_visual()
Some examples are provided below.
irir_country()
This function allows you to find and search the right country code associated with the IRI Scoreboard’s data. If no argument is filed, all indicators will be displayed.
#Loading the sipR package
library(iriR)

#Get the ISO code for a specific country
myCountry <- irir_country("Canada")
myCountry
    country_name country_code
161       Canada          CAN
In this case if you want data for Canada, you’ll need to write country = "CAN" in the irir_data() function.
irir_indicator()
This function allows you to find and search the right indicator code from the IRI Scoreboard you want to use. If no argument is filed, all indicators will be displayed.
#Search for an indicator
myIndicator <- irir_indicator("R&D")
myIndicator
                                                            indicator_name
1                        Research and Development (R&D) investment in euro
2  Research and Development (R&D) investment growth over the previous year
5                                 Research and Development (R&D) intensity
17                        Research and Development (R&D) investment in USD
   indicator_code
1         RD.euro
2    RD.1y.growth
5    RD.intensity
17         RD.usd
                                                                                                                                                                                                                                                                                                                                                                                                                                                                                                                                                                                                                                                                                                                                                                                                                                                                                                                                                                                                                                                                                                                                                                                                                                                                                                                                                                                                                                                                                                                                                                                                                                                                                                                                                                                                                                                                                                                                                                          indicator_definition
1                                                                                                                                                                                                                                                                                                                                                                                                                    Research and Development (R&D) investment in the Scoreboard is the cash investment funded by the companies themselves. It excludes R&D undertaken under contract for customers such as governments or other companies. It also excludes the companies' share of any associated company or joint venture R&D investment. However, it includes research contracted out to other companies or public research organisations, such as universities. Being that disclosed in the annual report and accounts, it is subject to the accounting definitions of R&D. For example, a definition is set out in International Accounting Standard (IAS) 38 “Intangible assets” and is based on the OECD “Frascati” manual. Research is defined as original and planned investigation undertaken with the prospect of gaining new scientific or technical knowledge and understanding. Expenditure on research is recognised as an expense when it is incurred. Developmentis the application of research findings or other knowledge to a plan or design for the production of new or substantially improved materials, devices, products, processes, systems or services before the start of commercial production or use. Development costs are capitalised when they meet certain criteria and when it can be demonstrated that the asset will generate probable future economic benefits. Where part or all of R&D costs have been capitalised, the additions to the appropriate intangible assets are included to calculate the cash investment and any amortisation eliminated.
2  Research and Development (R&D) investment in the Scoreboard is the cash investment funded by the companies themselves. It excludes R&D undertaken under contract for customers such as governments or other companies. It also excludes the companies' share of any associated company or joint venture R&D investment. However, it includes research contracted out to other companies or public research organisations, such as universities. Being that disclosed in the annual report and accounts, it is subject to the accounting definitions of R&D. For example, a definition is set out in International Accounting Standard (IAS) 38 “Intangible assets” and is based on the OECD “Frascati” manual. Research is defined as original and planned investigation undertaken with the prospect of gaining new scientific or technical knowledge and understanding. Expenditure on research is recognised as an expense when it is incurred. Developmentis the application of research findings or other knowledge to a plan or design for the production of new or substantially improved materials, devices, products, processes, systems or services before the start of commercial production or use. Development costs are capitalised when they meet certain criteria and when it can be demonstrated that the asset will generate probable future economic benefits. Where part or all of R&D costs have been capitalised, the additions to the appropriate intangible assets are included to calculate the cash investment and any amortisation eliminated. One-year growth is simple growth over the previous year, expressed as a percentage: 1 yr growth = 100*((C/B)-1);where C = current year amount and B = previous year amount. 1yr growth is calculated only if data exist for both the current and previous year. At the aggregate level, 1yr growth is calculated only by aggregating those companies for which data exist for both the current and previous year.
5                                                                                                                                                                                                                                                                                                                                                                                                                                                                                                                                                                                                                                                                                                                                                                                                                                                                                                                                                                                                                                                                                                                                                                                                                                                                                                                                                                                                                                                                                                                                               R&D intensity is the ratio between R&D investment and net sales of a given company or group of companies. At the aggregate level, R&D intensity is calculated only by those companies for which data exist for both R&D and net sales in the specified year. The calculation of R&D intensity in the Scoreboard is different from than in official statistics, e.g. BES-R&D, where R&D intensity is based on value added instead of net sales.
17                                                                                                                                                                                                                                                                                                                                                                               Research and Development (R&D) investment in the Scoreboard is the cash investment funded by the companies themselves. It excludes R&D undertaken under contract for customers such as governments or other companies. It also excludes the companies' share of any associated company or joint venture R&D investment. However, it includes research contracted out to other companies or public research organisations, such as universities. Being that disclosed in the annual report and accounts, it is subject to the accounting definitions of R&D. For example, a definition is set out in International Accounting Standard (IAS) 38 “Intangible assets” and is based on the OECD “Frascati” manual. Research is defined as original and planned investigation undertaken with the prospect of gaining new scientific or technical knowledge and understanding. Expenditure on research is recognised as an expense when it is incurred. Developmentis the application of research findings or other knowledge to a plan or design for the production of new or substantially improved materials, devices, products, processes, systems or services before the start of commercial production or use. Development costs are capitalised when they meet certain criteria and when it can be demonstrated that the asset will generate probable future economic benefits. Where part or all of R&D costs have been capitalised, the additions to the appropriate intangible assets are included to calculate the cash investment and any amortisation eliminated. (Calculated in constant US dollars)
In this case if you want data for the Research and Development (R&D) investment in USD, you’ll need to write indicators = "RD.usd" in the irir_data() function.
irir_industry()
This function allows you to find and search the right industry name from the IRI Scoreboard you want to use. If no argument is filed, all indicators will be displayed.
#Search for an indicator
myIndustry <- irir_industry("Auto")
myIndustry
[1] "Automobiles & Parts"In this case if you want data for the Automobile industry, you’ll need to write industry = "Automobiles & Parts" in the irir_data() function.
irir_company()
This function allows you to find and search for the right company’s name you want to use from the IRI Scoreboard. If no argument is filed, all companies will be displayed.
#Search for an indicator
myCompany <- irir_company("Amazon")
myCompany
[1] "AMAZON.COM"In this case if you want data for the company Amazon, you’ll need to write company = "AMAZON.COM" in the irir_data() function.
irir_data()
First, the function irir_data() takes as an input the countries we’re interested in. We specify this argument with the countries ISO code, as such: c("USA", "FRA", "BRA", "CHN", "ZAF", "CAN"). The second argument is dedicated for the years for which we want data. Finally, we need to specify the indicator we would like to extract. You can also look for the industry, company and rank you’re interested in.
For example, let’s take a look at the RD.usd (Research and Development (R&D) investment in USD) indicator for the countries listed above.
#Extracting the data
myData <- irir_data(country = c("USA", "FRA", "BRA", "CHN", "ZAF", "CAN"),
                       years = c("2014","2015","2016", "2017", "2018", "2019"),
                       indicators = "RD.usd")
head(myData)
   country_name country_code year rank
1 United States          USA 2019    1
2 United States          USA 2019    3
3         China          CHN 2019    5
4 United States          USA 2019    6
5 United States          USA 2019    7
6 United States          USA 2019    9
                     company_name                   industry_name
1                        ALPHABET    Software & Computer Services
2                       MICROSOFT    Software & Computer Services
3 HUAWEI INVESTEMENT & HOLDING CO Technology Hardware & Equipment
4                           APPLE Technology Hardware & Equipment
5                           INTEL Technology Hardware & Equipment
6               JOHNSON & JOHNSON Pharmaceuticals & Biotechnology
  indicator_code       value
1         RD.usd 18701866054
2         RD.usd 15086648735
3         RD.usd 13040257160
4         RD.usd 12726566212
5         RD.usd 12107044549
6         RD.usd  9632533783
We can now compare these countries investments based on the RD.usd indicator.
irir_visual()
This function allows you to produce graphs on the iriR data. You can choose the country, the type of chart (it will produce different type of graphs and indicators), the title appearing or not and the year.
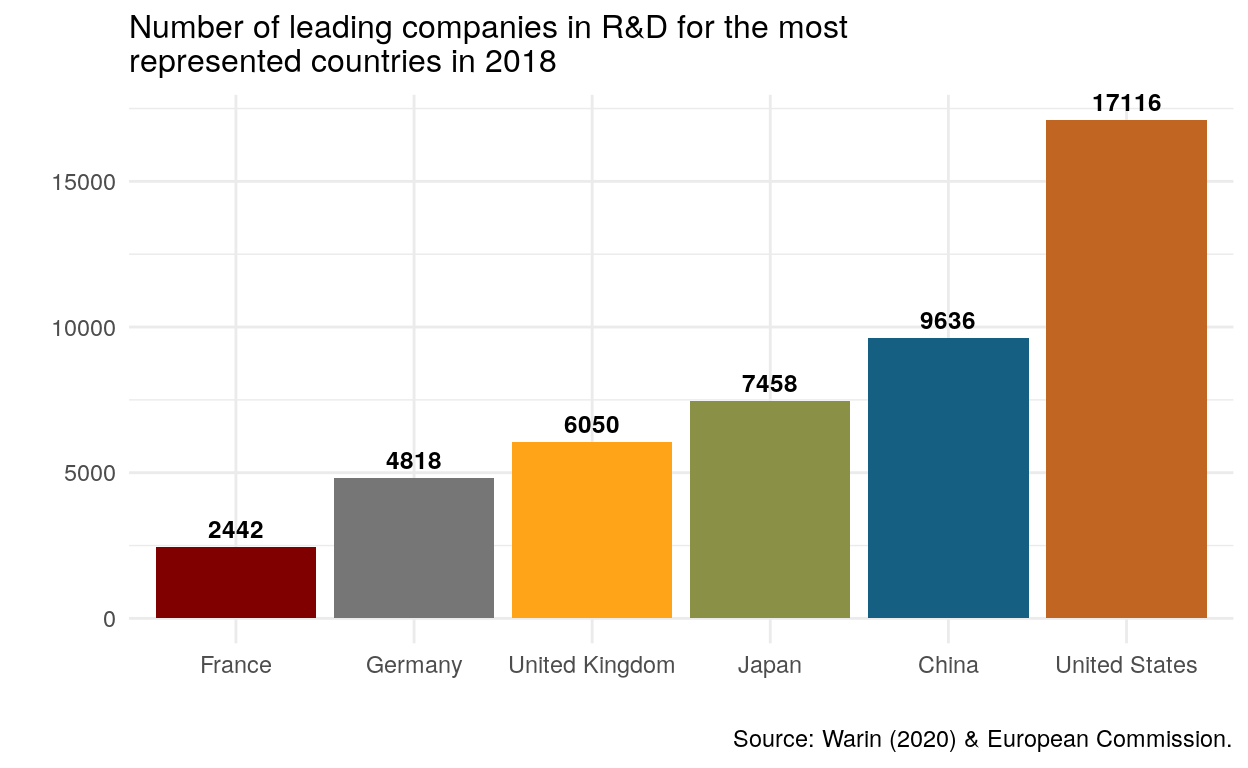
irir_visual(country = "FRA", chart = "bar_1", title = TRUE, years = 2018)
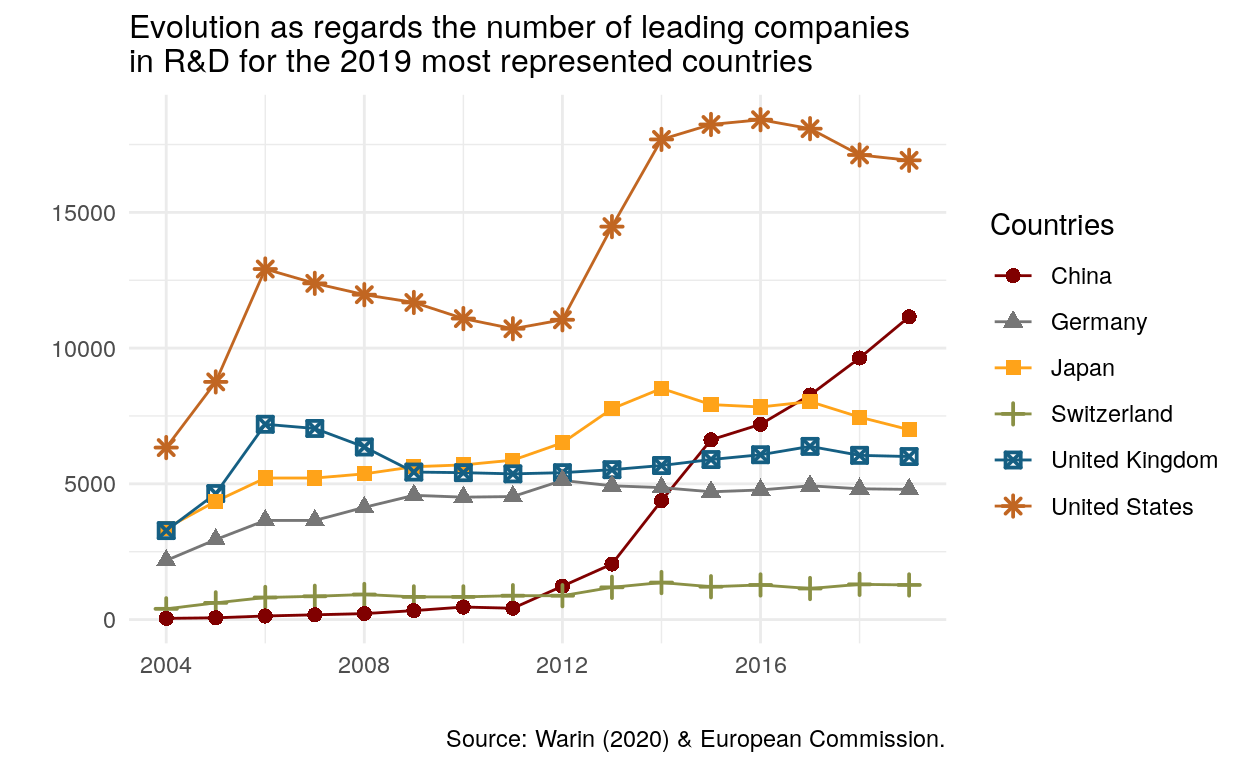
irir_visual(country = "CHE", chart = "line_1", title = TRUE)
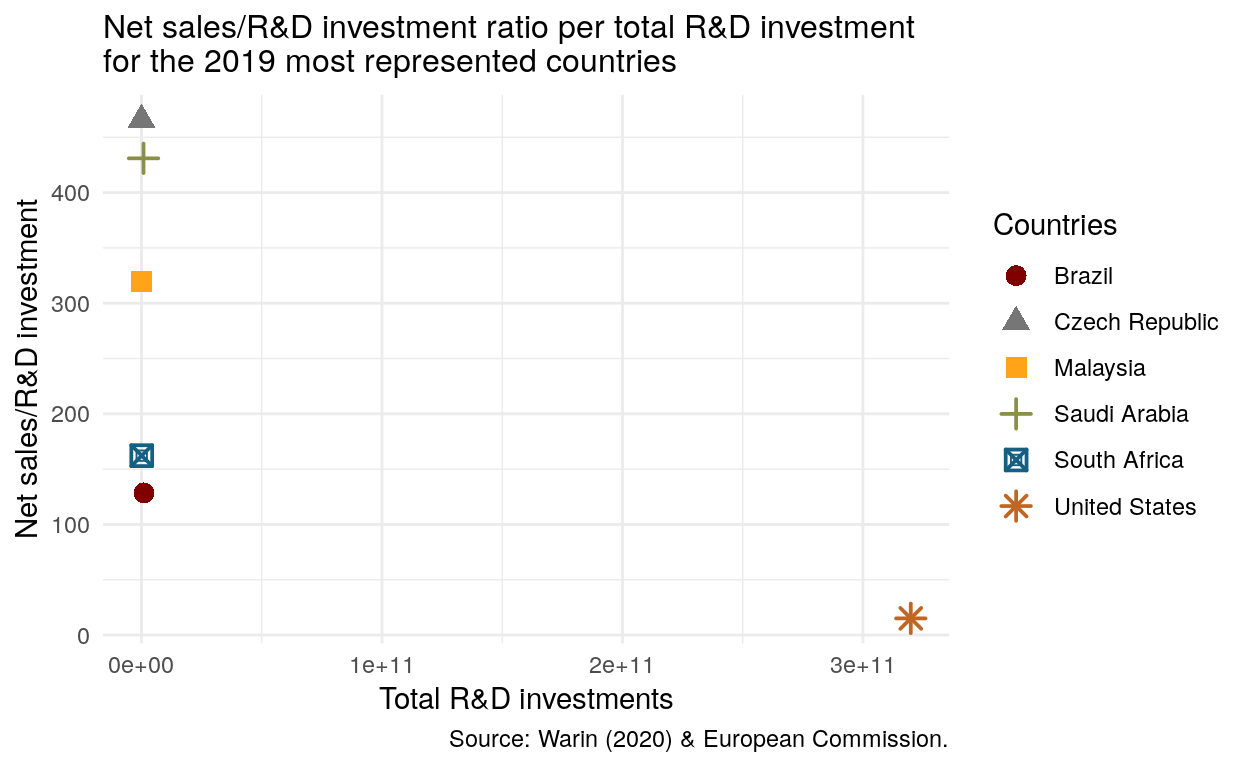
irir_visual(country = "USA", chart = "point_1", title = TRUE)
tl;dr
#Loading the sipR package
library(iriR)

#Get the ISO code for a specific country
myCountry <- irir_country("Canada")
myCountry

#Search for an indicator
myIndicator <- irir_indicator("R&D")
myIndicator

#Search for an industry
myIndustry <- irir_industry("Auto")
myIndustry

#Search for a company
myCompany <- irir_company("Amazon")
myCompany

#Extracting the data
myData <- irir_data(country = c("USA", "FRA", "BRA", "CHN", "ZAF", "CAN"),
                       years = c("2014","2015","2016", "2017", "2018", "2019"),
                       indicators = "RD.usd")
myData

irir_visual(country = "FRA", chart = "bar_1", title = TRUE, years = 2018)
irir_visual(country = "CHE", chart = "line_1", title = TRUE)
irir_visual(country = "USA", chart = "point_1", title = TRUE)
Code learned this week
| Command | Detail |
|---|---|
| irir_data() | Extract data |
| irir_country() | Search for a country’s ISO code |
| irir_indicator() | Search for an indicator code |
| irir_company() | Search for a company name |
| irir_industry() | Search for an industry name |
| irir_visual() | Produce charts |
References
This tutorial uses the iriR package documentation