This course will teach you how to use the OECD package.
Retrieve data
# Loading OECD library
library(OECD)

# get_datasets()
dataset_list <- get_datasets() # this function will show you all the different datasets available

# search dataset()
search_dataset("unemployment", data = dataset_list) # this function will help you narrow your search of a specific dataset
                    id
92               DUR_I
93               DUR_D
157            AVD_DUR
669   AEO2012_CH6_FIG4
700  AEO2012_CH6_FIG29
746  AEO2012_CH6_FIG19
950              PTRUB
1305               NRR
1306               GRR
1405           PTRCCUB
                                                                                   title
92                                                 Incidence of unemployment by duration
93                                                              Unemployment by duration
157                                                     Average duration of unemployment
669                                               Figure 4: Youth and adult unemployment
700  Figure 29: Youth employment and unemployment by education and country income groups
746              Figure 19: The trade off between vulnerable employment and unemployment
950                                      PTR for families claiming Unemployment Benefits
1305                                                Net replacement rate in unemployment
1306                                             Gross Replacement Rates in unemployment
1405         PTR for parents claiming Unemployment Benefits and using childcare services
# choose your dataset and show the data in a data frame
dataset <- "DUR_D"
Extract data
# show the data in a data frame

dstruc <- get_data_structure(dataset)
str(dstruc, max.level = 1)
List of 12
 $ VAR_DESC       :'data.frame':    12 obs. of  2 variables:
 $ COUNTRY        :'data.frame':    53 obs. of  2 variables:
 $ TIME           :'data.frame':    52 obs. of  2 variables:
 $ SEX            :'data.frame':    3 obs. of  2 variables:
 $ AGE            :'data.frame':    7 obs. of  2 variables:
 $ DURATION       :'data.frame':    8 obs. of  2 variables:
 $ FREQUENCY      :'data.frame':    1 obs. of  2 variables:
 $ OBS_STATUS     :'data.frame':    16 obs. of  2 variables:
 $ UNIT           :'data.frame':    318 obs. of  2 variables:
 $ POWERCODE      :'data.frame':    32 obs. of  2 variables:
 $ REFERENCEPERIOD:'data.frame':    96 obs. of  2 variables:
$ TIME_FORMAT :'data.frame': 5 obs. of 2 variables:dstruc$VAR_DESC # show this variable in a table
                id        description
1          COUNTRY            Country
2             TIME               Time
3              SEX                Sex
4              AGE                Age
5         DURATION           Duration
6        FREQUENCY          Frequency
7        OBS_VALUE  Observation Value
8      TIME_FORMAT        Time Format
9       OBS_STATUS Observation Status
10            UNIT               Unit
11       POWERCODE    Unit multiplier
12 REFERENCEPERIOD Reference perioddstruc$SEX # show this variable in a table
     id       label
1   MEN         Men
2 WOMEN       Women
3 MW All personsdstruc$AGE # show this variable in a table
      id    label
1   1519 15 to 19
2   1524 15 to 24
3   2024 20 to 24
4   2554 25 to 54
5   5564 55 to 64
6   6599      65+
7 900000    Total
# filter your results
filter_list <- list(c("CAN", "FRA", "USA", "GBR"), "MW", "900000")
df <- get_dataset(dataset = dataset, filter = filter_list)
head(df)
  COUNTRY SEX    AGE DURATION FREQUENCY TIME_FORMAT obsTime obsValue
1     CAN  MW 900000      UN1         A         P1Y    1976    233.2
2     CAN  MW 900000      UN1         A         P1Y    1977    264.8
3     CAN  MW 900000      UN1         A         P1Y    1978    273.7
4     CAN  MW 900000      UN1         A         P1Y    1979    273.0
5     CAN  MW 900000      UN1         A         P1Y    1980    289.2
6     CAN  MW 900000      UN1         A         P1Y    1981    305.5
# choose one time frame in the DURATION data frame
unique(df$DURATION)
[1] "UN1" "UN2" "UN3" "UN4" "UN5" "UN" "UND" "UNK"dstruc$DURATION # show this variable in a table
   id                    label
1 UN1                < 1 month
2 UN2 > 1 month and < 3 months
3 UN3 > 3 month and < 6 months
4 UN4   > 6 month and < 1 year
5 UN5          1 year and over
6  UN                    Total
7 UND           Total Declared
8 UNK                  Unknown
Visualize data
# We will use the "UN" DURATION for this example

df_plot <- df[df$DURATION == "UN", ]

# Data wrangling

df_plot$obsTime <- as.numeric(df_plot$obsTime) # make sure the variable is in a numeric format

library(ggplot2)

palette <- c("black", "#f8c72d", "#db0a16", "#255293")

qplot(data = df_plot, x = obsTime, y = obsValue, geom = c("line","point"), color = COUNTRY) +
  labs(x = NULL, y = "Persons, thousands", color = NULL, title = "Long-term unemployement") +
  theme_minimal() +
  scale_color_manual(values = palette)
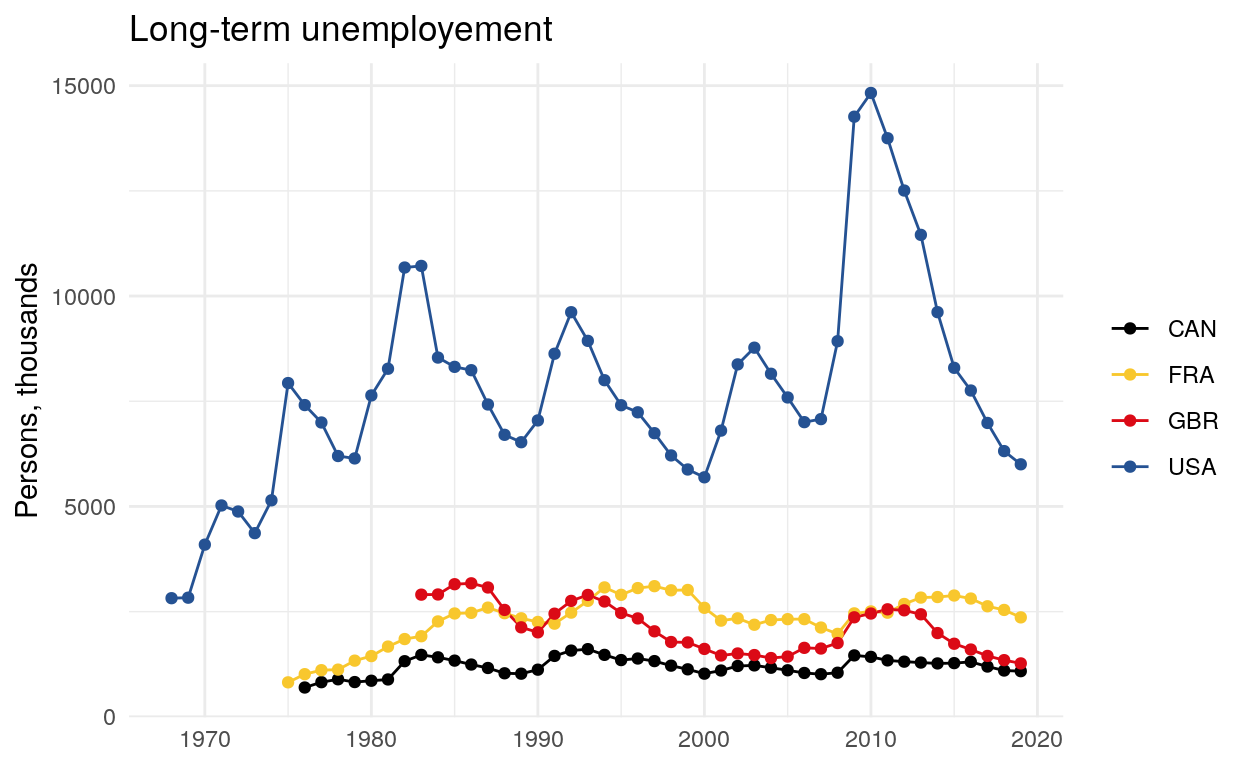
The line chart above illustrates long term unemployement in Canada, France, the United Kingdom and the US since the 1970s. We can easily tell that around 2010, many people in the US were unemployed.