
Database description
Quantmod is an R package designed to access financial data. It is a useful package to make quantitative analysis on the financial market. The environnement offers tools to explore different trading models and create some.
Quantmod: https://github.com/joshuaulrich/quantmod
Functions
Several functions are embedded in this library to obtain financial data, for example:
- getSymbols(): stock data
- barChart(): data visualisation
- getDividends(): stock dividend data
Each of these functions are detailed in this course and some examples are provided.
getSymbols()
The function getSymbols() takes as an input the ticker of the stock researched. It then requires the user to specify the timeframe of the data. It will then provide data regarding the price of the stock.
For example, we would like to download stock data regarding “Apple Inc.” (ticker: AAPL) from May, 2nd of 2016 until October, 2nd of 2016. All data will be stored in a variable named “AAPL”.
#Loading the quantmod library
library(quantmod)

# Access financial information on Apple stock
getSymbols("AAPL",src="yahoo", from="2016-05-02", to="2017-10-02")
[1] "AAPL"head(AAPL)
           AAPL.Open AAPL.High AAPL.Low AAPL.Close AAPL.Volume
2016-05-02   23.4925   23.5200  23.1000    23.4100   192640400
2016-05-03   23.5500   23.9350  23.4200    23.7950   227325200
2016-05-04   23.8000   23.9750  23.4550    23.5475   164102000
2016-05-05   23.5000   23.5175  23.1700    23.3100   143562000
2016-05-06   23.3425   23.3625  22.9625    23.1800   174799600
2016-05-09   23.2500   23.4425  23.1475    23.1975   131745600
           AAPL.Adjusted
2016-05-02      21.77385
2016-05-03      22.13194
2016-05-04      21.90174
2016-05-05      21.81284
2016-05-06      21.69119
2016-05-09      21.70757
You can also download and store your data in a .csv file.
# Download data
write.table(AAPL, file = "AAPL.csv", row.names=FALSE, col.names=TRUE, sep=",")
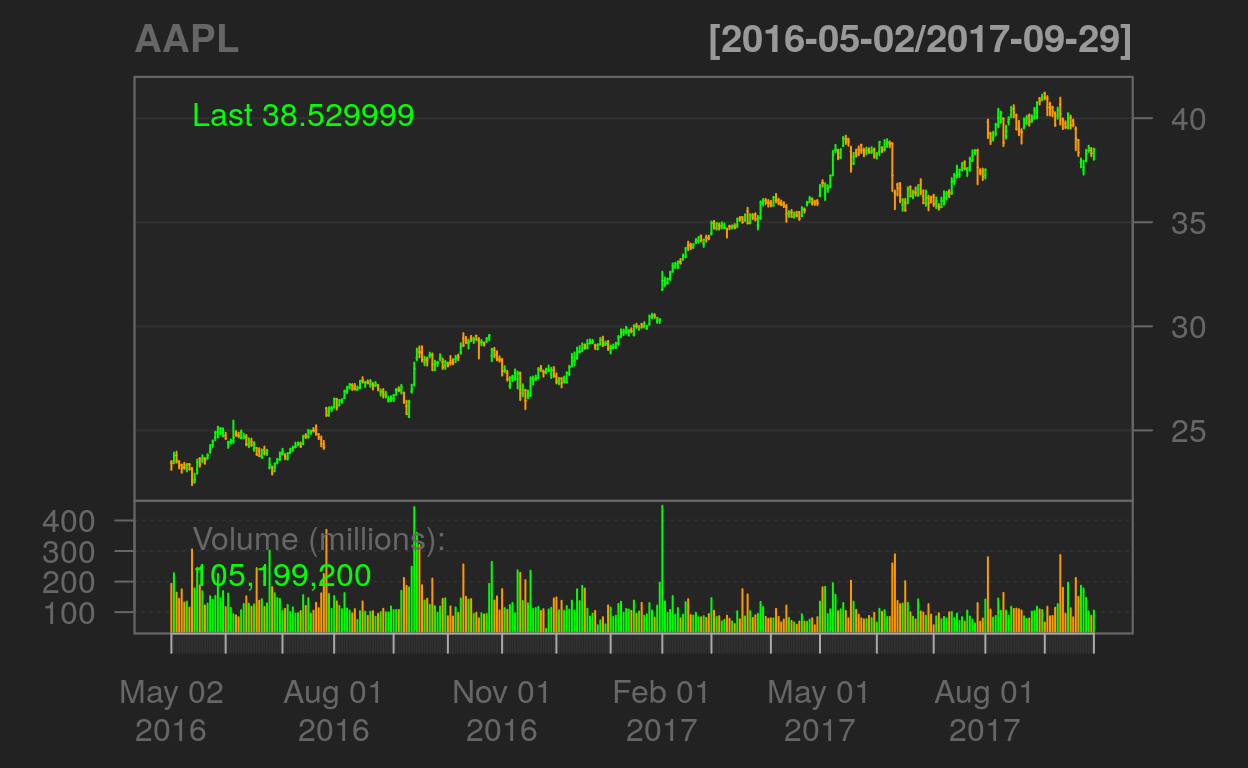
barChart()
To visualize your data, you need to call the function barChart(). It will showcase the price evolution and highlight posiive and negative trading days. Moreover, you will be able to visualize the volume of traded stocks per day.
# Visualize in a bar chart, with volume traded
barChart(AAPL)
You can also download and store your data in a .csv file.
# Download data
write.table(AAPL, file = "AAPL.csv", row.names=FALSE, col.names=TRUE, sep=",")
getDividends()
Furthermore, to help you analyse your stock, you can also access the dividend of the company with the function getDividends(). It also takes as an input the ticker of the stock researched. It then requires the user to specify the timeframe of the data.
# Get the dividend data
getDividends("AAPL",src="yahoo", from="2016-05-02", to="2017-10-02")
           AAPL.div
2016-05-05 0.035625
2016-08-04 0.035625
2016-11-03 0.035625
2017-02-09 0.035625
2017-05-11 0.039375
2017-08-10 0.039375
tl;dr
#Loading the quantmod library
library(quantmod)

# Access financial information on Apple stock
getSymbols("AAPL",src="yahoo", from="2016-05-02", to="2017-10-02")


head(AAPL)

# Visualize in a bar chart, with volume traded
barChart(AAPL)

# Download data
write.table(AAPL, file = "AAPL.csv", row.names=FALSE, col.names=TRUE, sep=",")

# Get the dividend data
getDividends("AAPL",src="yahoo", from="2016-05-02", to="2017-10-02")
Code learned this week
| Command | Detail |
|---|---|
| getSymbols() | stock data |
| barChart() | Financial data visualisation |
| getDividends() | stock dividend data() |
References
This tutorial uses the quantmod package documentation