Learn how to customize the color of your visuals with the help of the paletteer package. (Hvitfeldt 2020; Laken 2020)
Palettes are divided into 2 groups: discrete and continuous.
Discrete Palettes
For discrete palette you have the choice between the fixed width palettes and dynamic palettes.
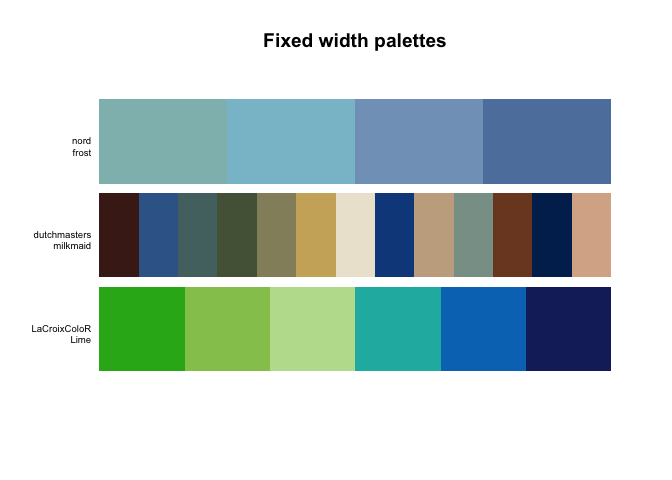
Fixed width palettes
Fixed width palettes (Most common of the discrete palette): They have a set amount of colors which doesn’t change when the number of colors requested vary like the following palettes:
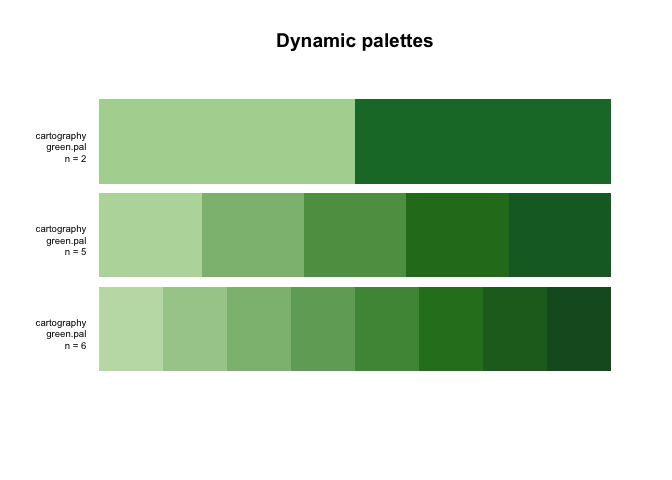
Dynamic palettes
Dynamic palettes: Where the colors of the palette depend on the number of colors you need like the green.pal palette from the cartography package:
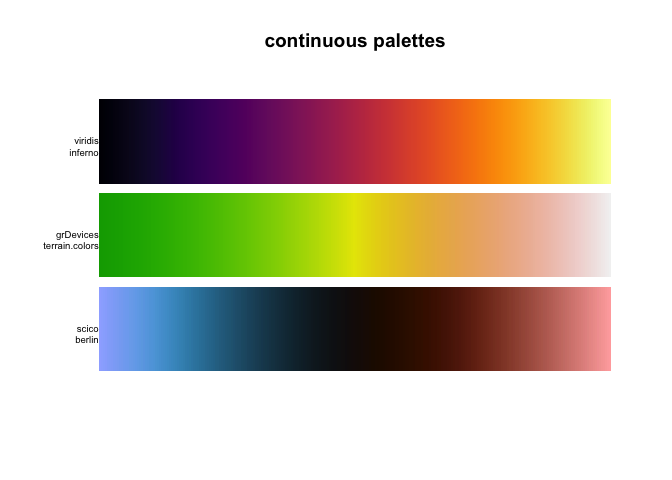
Continuous Palettes
Continuous palettes: They provides as many colors as you need for a smooth transition of color.
This package includes 1771 from 50 different packages and information about these can be found in the following data.frames: palettes_c_names, palettes_d_names and palettes_dynamic_names
All the palettes can be accessed from the 3 functions paletteer_c(), paletteer_d() and paletteer_dynamic() using the by using the syntax packagename::palettename.
paletteer works as easy as just adding one additional line of code to your ggplot:
Examples
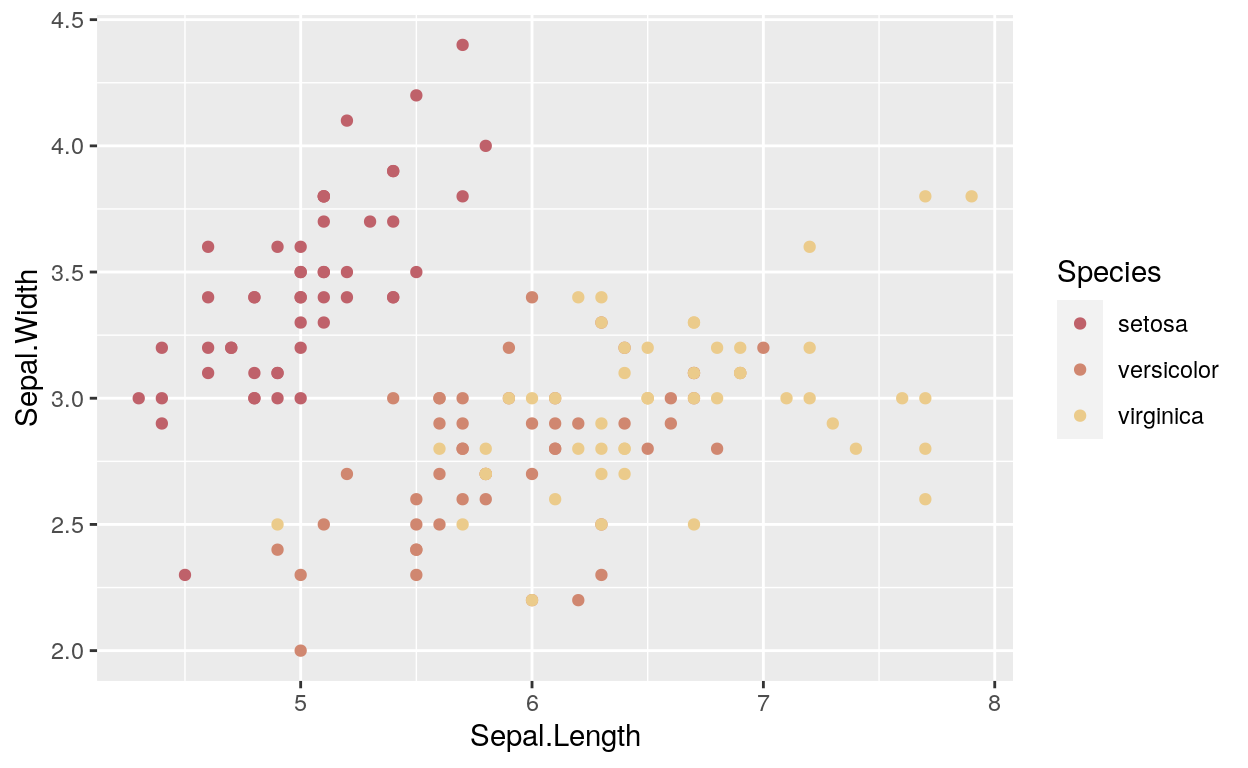
Example 1
library(paletteer)
library(ggplot2)

ggplot(iris, aes(Sepal.Length, Sepal.Width, color = Species)) +
  geom_point() +
  scale_color_paletteer_d("nord::aurora")
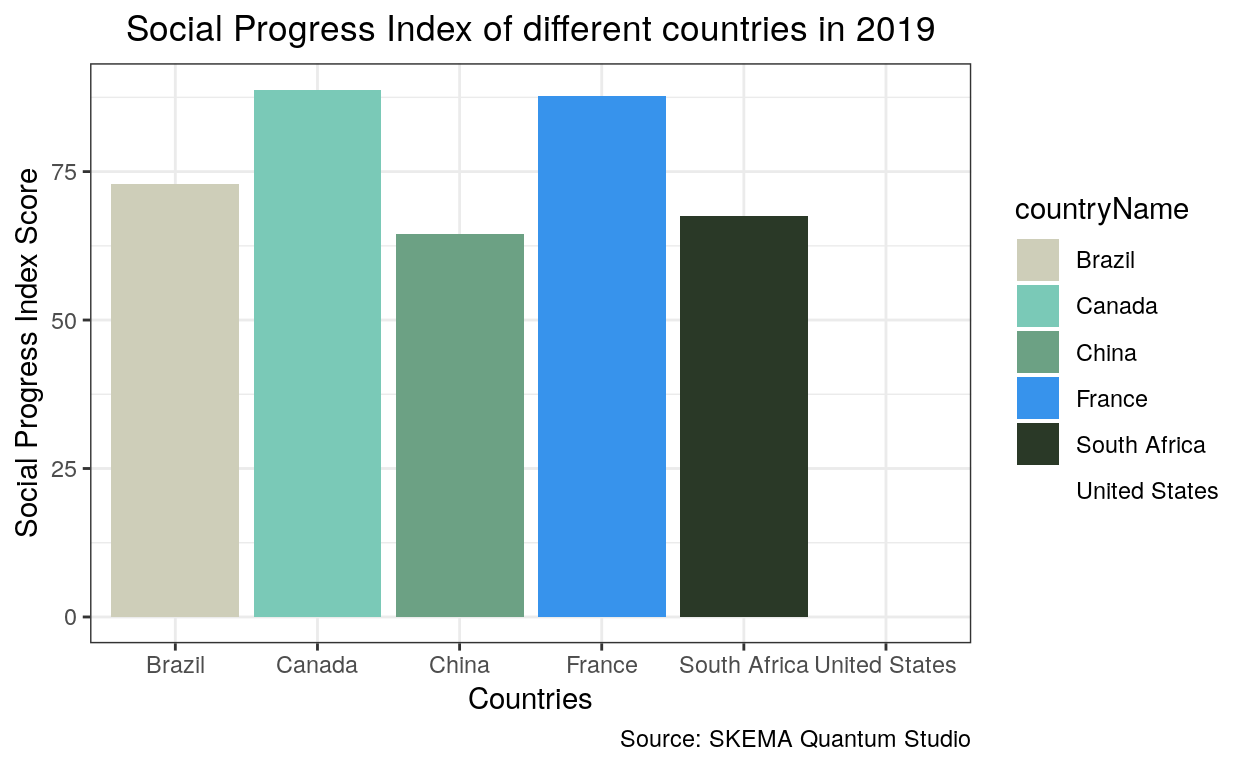
Example 2
use this line of code to customize the color of your visuals
scale_fill_paletteer_d(name of the palette)
ggplot(data = myData, aes(x = countryName, y = value, fill = countryName)) +
  geom_col() +
  theme_bw() +
  theme(plot.title = element_text(hjust = 0.5)) +
  scale_fill_paletteer_d("calecopal::lake") +
  labs(title = "Social Progress Index of different countries in 2019",
       x = "Countries",
       y = "Social Progress Index Score",
       colour = "Countries",
       caption = "Source: Nüance-R")
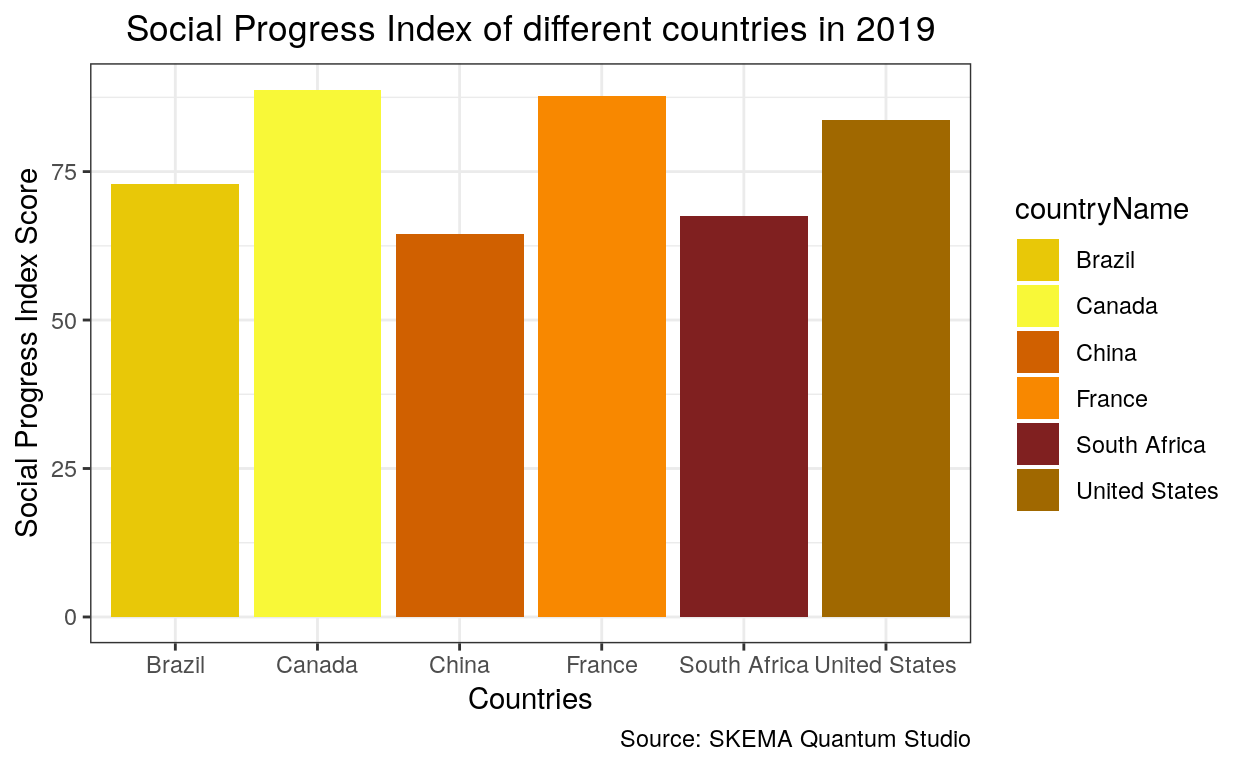
ggplot(data = myData, aes(x = countryName, y = value, fill = countryName)) +
  geom_col() +
  theme_bw() +
  theme(plot.title = element_text(hjust = 0.5)) +
  scale_fill_paletteer_d("palettetown::flareon") +
  labs(title = "Social Progress Index of different countries in 2019",
       x = "Countries",
       y = "Social Progress Index Score",
       colour = "Countries",
       caption = "Source: Nüance-R")
Hvitfeldt, Emil. 2020. “EmilHvitfeldt/Paletteer.” https://github.com/EmilHvitfeldt/paletteer.
Laken, Paul van der. 2020. “Paletteer: Hundreds of Color Palettes in R.” Paulvanderlaken.com. https://paulvanderlaken.com/2020/03/17/paletteer-hundreds-of-color-palettes-in-r/.