Nüance-R provides this course to teach you how to create a diagram.
Open the following packages
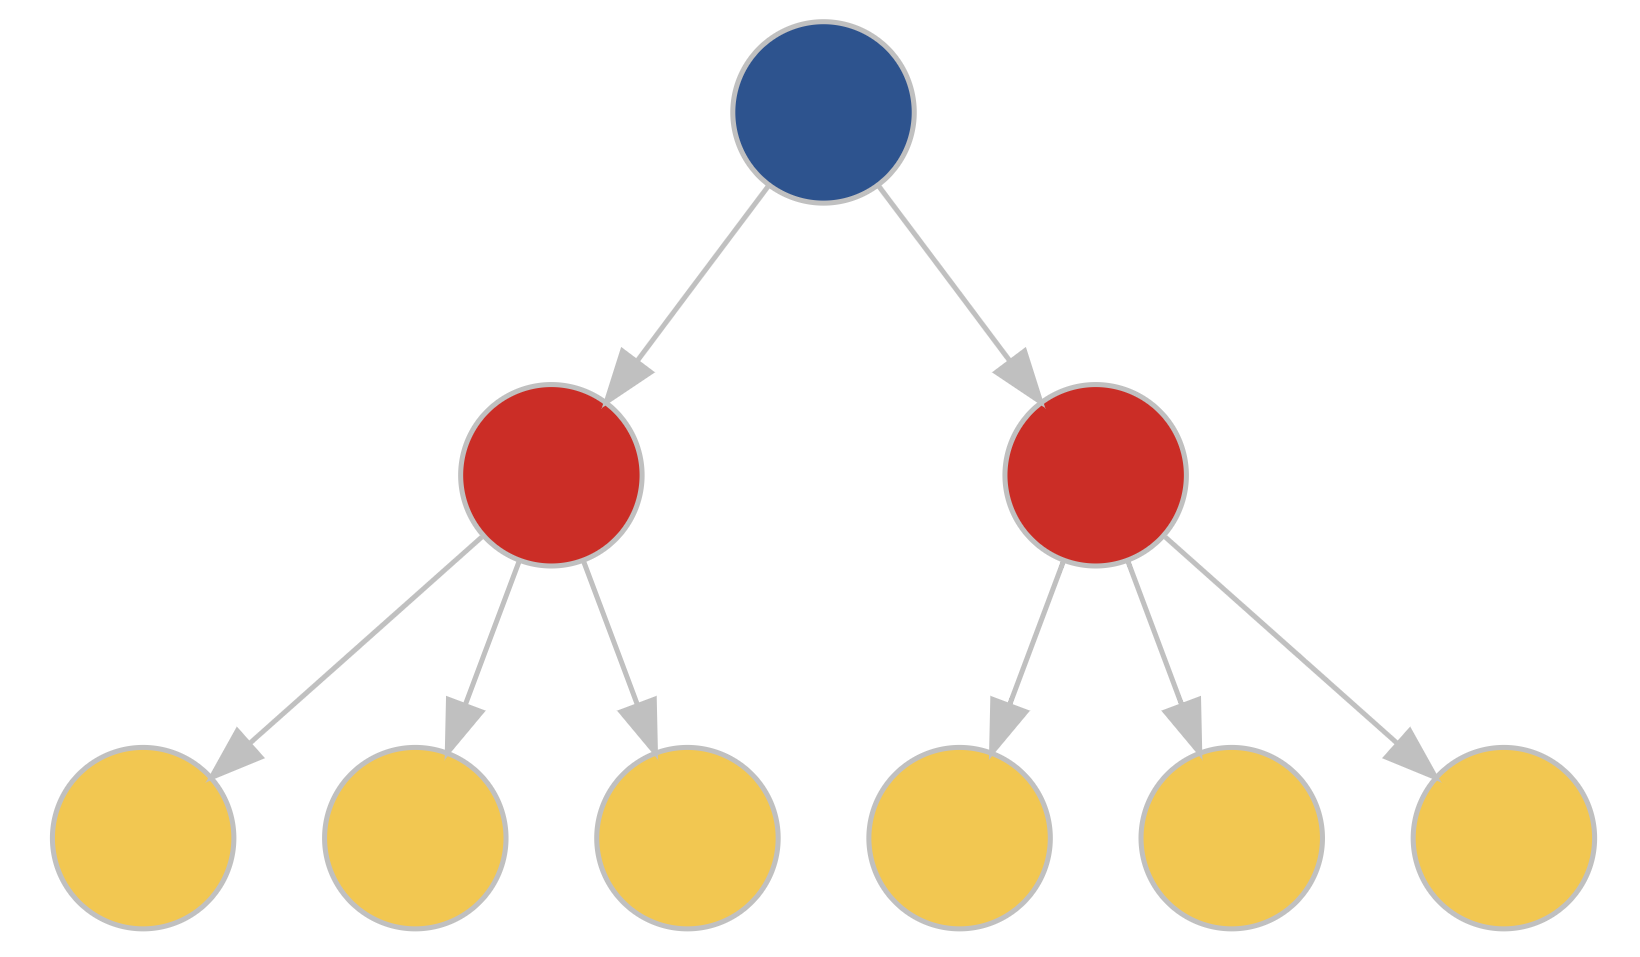
Create your diagram
DiagrammeR::grViz([1303 chars quoted with '"'])
For more information about the diagrammeR package, click here
Easily create diagrams with R by using DiagrammeR.
Nüance-R provides this course to teach you how to create a diagram.
DiagrammeR::grViz([1303 chars quoted with '"'])
For more information about the diagrammeR package, click here
For attribution, please cite this work as
Warin (2020, Jan. 30). Thierry Warin, PhD: [R Course] How to: Create Diagrams. Retrieved from https://warin.ca/posts/rcourse-howto-creatediagrams/
BibTeX citation
@misc{warin2020[r,
  author = {Warin, Thierry},
  title = {Thierry Warin, PhD: [R Course] How to: Create Diagrams},
  url = {https://warin.ca/posts/rcourse-howto-creatediagrams/},
  year = {2020}
}