Nüance-R provides an Addin called 'ggplot2' builder created by the R package Esquisse (Meyer, Perrier, and support) 2019) to create graphs by only drag-and-drop!
To use the add-in:
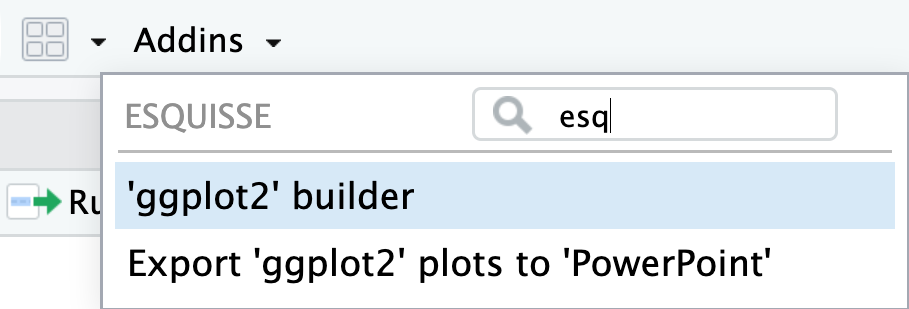
Step 1
Click on the Addins button and look for the esquisse application. Click on the name ‘ggplot2’ builder.
Step 2
A window will open.
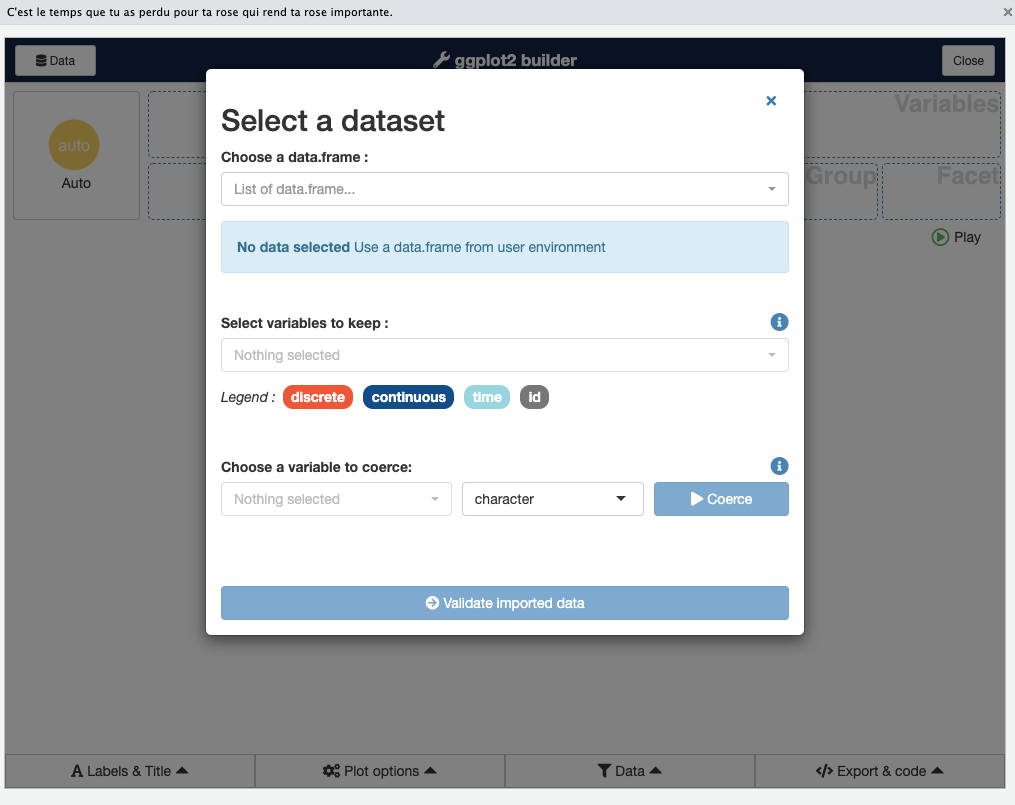
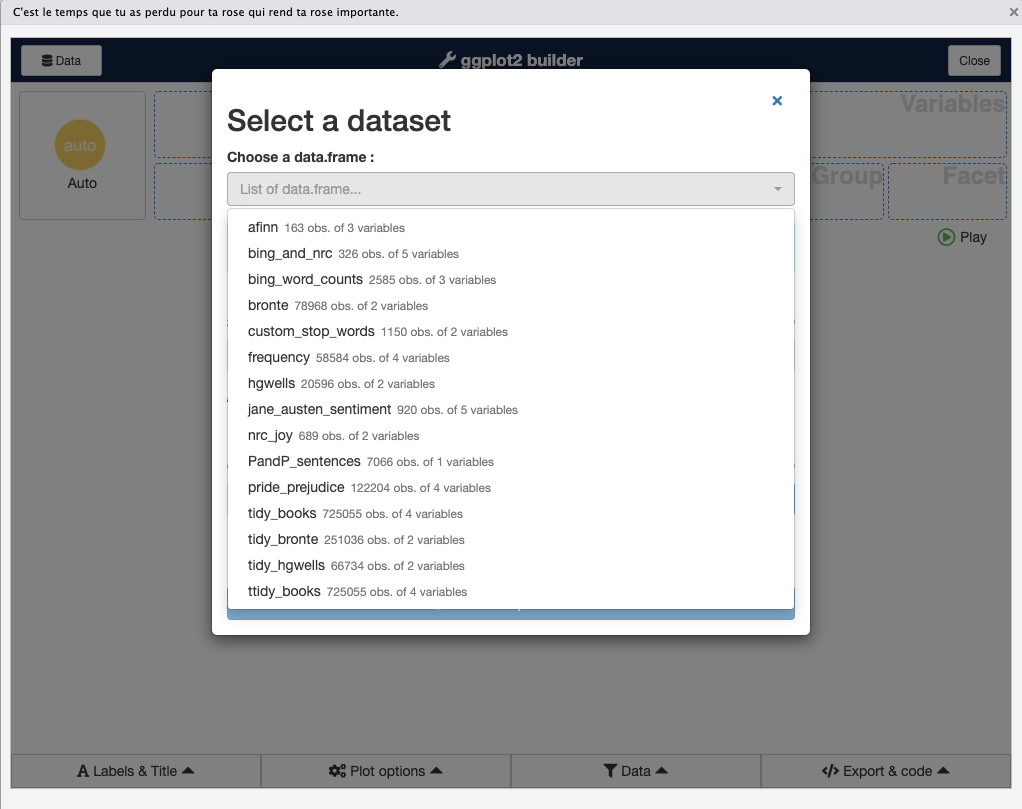
Step 3
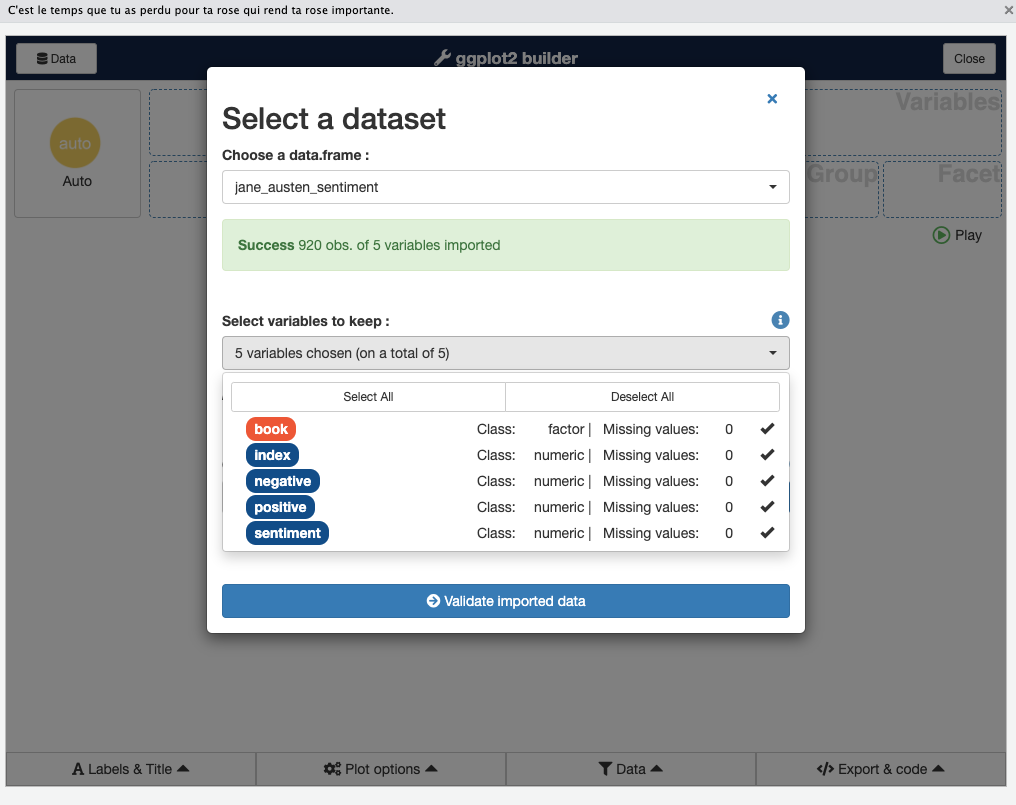
Click on the bar named list of dataframes… and choose one of the data frames loaded into your current working session.
Step 4
If you click the Validate Chosen Variable dropdown, you see all the available columns and can choose which ones you want. To keep them all, click Choose.
Step 5
You should see a drag-and-drop interface. You should be able to drag one variable into the X box and another into the Y box, as well as choose others for fill or size (depending on the visualization type).
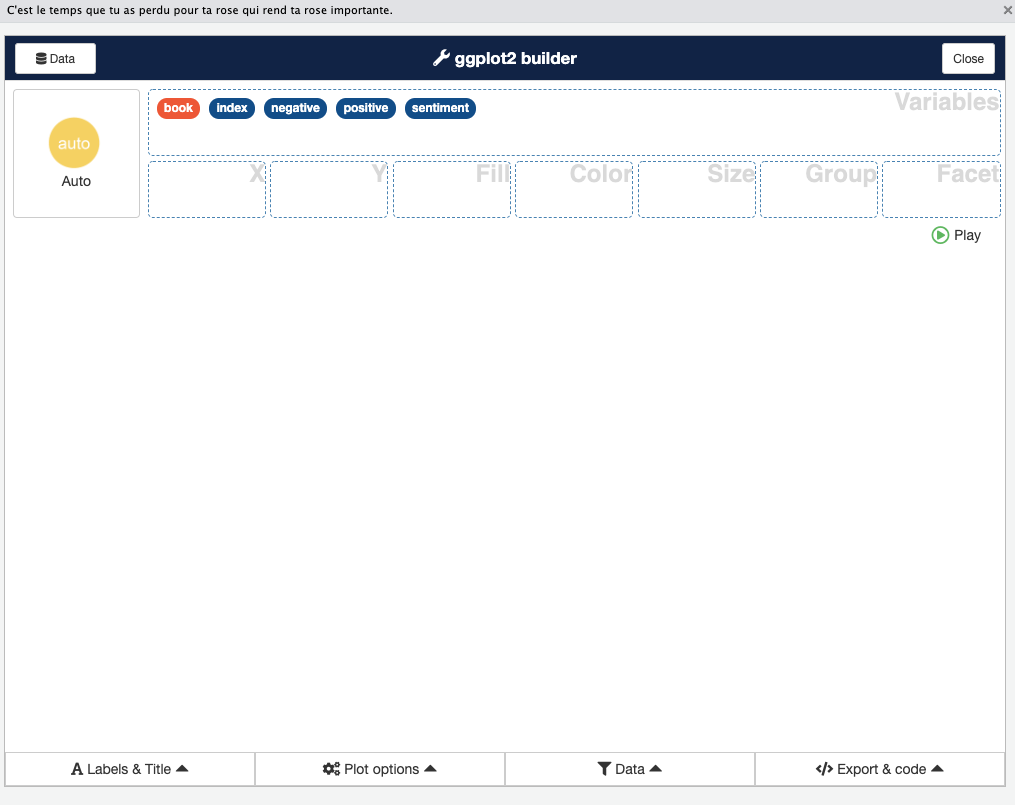
The Data panel at the bottom gives you the option to filter your data. You can change axis titles with the Labels & Title option. Plot options let you change color palette and theme, and also move or remove the legend.
Even if you’re really comfortable creating your graphs by writing ggplot code, this is a great way to see how different color palettes and themes look on your graph.
Meyer, Fanny, Victor Perrier, and Ian Carroll (Facets support). 2019. “Esquisse: Explore and Visualize Your Data Interactively.” https://CRAN.R-project.org/package=esquisse.