Chapter 5 R
5.1 Introduction
In this first chapter, you will familiarize yourself with one of the important aspects of a data pipeline: R.
Remember, the goal of this book is to harness the power of data science tools for business. In this regard, we promote reproducible research as our research method. In order to do so, RStudio, with documents written in Markdown, will be your main portal for doing your projects. You will learn a few syntax tips regarding Markdown and how to save your projects online (Git). Throughout the chapters, useful tips will be either displayed in bold or in italics.
At the end of the chapter, you should be able to:
- understand the power of R;
- know the difference between a package and a library;
- what a pipe is;
5.2 R
R is a functional language. It is built around functions taht integrate long lines of code. A user has to remember the name of the function and what it does. Then, the lines of code will accomplish their task. Other functional languages are Python and my favorite: Julia.
Functional languages come with a lot of benefits, and the major one is that they are the easiest way to accomplish the most complicated tasks with a language that is close to the natural language. It is true that you can perform extremely complex tasks with just a few lines of code. For instance, you can collect all the patents in the world and start your analysis of the pace of innovation in an industry. You can also for instance collect all the academic references in epidemiology and analyze who are the most advanced teams in the world that you would like to fund to accelerate the discovery of a vaccine. This can be done for the most part on your computer. I am not saying your computer will do it in a millisecond - no, it can take 3 weeks of compiling - but it can happen. It can also meld your computer, right.
All this to insist on the fact that the new technologies combined with a functional language to communicate your human intentions to a computer allow businesses to transform. Moreover, beyond allowing businesses to transform, it obliges businesses to transform.
I believe we need a new crop of business leaders who are tech savvy in order to understand the data around them and devise internal and external strategies for their companies. This is what I am interested in.
In what follows, we will present the “grammar” of R. It is very similar to the grammar of the other functional languages. R is mostly used in biology, medicine, natural sciences, economics, Finance, psychology, sociology, and the humanities. It is more dedicated to people who basically need to write statistical or mathematically-based reports, such as business analysts, etc. Python is mostly used in engineering schools for a public that favors a more “software” approach. Julia is still in its infancy, but is the fastest of all the functional languages.
Once we know the grammar of one language, it is easy to move to another language. Being functional languages, they belong to the same family, with the same objectives, the same processes, etc.
Functional languages come also with issues. Anyone can create a function and thus complement the “native” instructions from the language. Authors need to make sure the name of the function will be compatible with the native instructions as well as with other functions creted by other people across the world.
The beauty of open source is that a lot of innovations happen and are shared across people through github for instance, but also a lot of incompatibilities may happen, corrected by the open source community anyway on Stackoverflow or other websites.
In the next section, we will review the grammar of R.
5.3 R Grammar
Library and packages are very close terms. So in the future, we will use either terms to mean the same thing.
5.3.1 Package::function()
To use a function, it must be refered to its package (package::function()). Otherwise, the document cannot run and the function would seem not to be working. That being said, they are more than one way to link your function to its package.
It can be used as follow:
dataUnido <- gsheet::gsheet2tbl("https://docs.google.com/spreadsheets/d/1uLaXke-KPN28-ESPPoihk8TiXVWp5xuNGHW7w7yqLCc/edit#gid=416085055")The function used here is gsheet2tbl() from the package gsheet. It’s simple and there is no chance to forget the package since it is right in front of the function. That being said, there is another way to refer to a package in order to use its functions.
5.3.2 Library(package)
Another way to refer a function to its package is to call your package using the library() function at the beggining of your document. The code line Library(package) is used to mention the needed package and allows the user to use any function of that package anywhere under that line without having to refer to it everytime. The user can then just write the function and what goes in it without having to worry about calling the package anymore.
So if the package is called using the library() function [library(package)] at the beginning of your document in a code chunk, the code could be function() instead of the usual package::function(). It is quicker and easier on the eye, especially if there’s more than one package used.
It can be use like this:
library(gsheet)

dataUnido <- gsheet2tbl("https://docs.google.com/spreadsheets/d/1uLaXke-KPN28-ESPPoihk8TiXVWp5xuNGHW7w7yqLCc/edit#gid=416085055")
A fast way to use this method is to store all the needed packages in a R chunk at the top of your document like so:
Here are some popular packages used in R markdown.
5.3.3 Piping
A pipe is represented by this sign: %>%.
The point of the pipe is to help you write code in a way that is easier to read and understand. In fact, “piping” makes your code more readable. Pipes are a powerful tool for clearly expressing a sequence of multiple operations.
To see why the pipe is so useful, let’s take a look at the most basic example that use the operator before you go into the more advanced usages of the operator in the Computing Summary Statistics section.
log(x) can be rewritten as x %>% log()
In short, this means that functions that take one argument, function(argument), can be rewritten as follows: argument %>% function(). Take a look at the following more practical example to understand how the function glimpse() can be used with pipes:
5.4 R terminology
5.4.1 Tidy Data
R follows a set of conventions that makes one layout of tabular data much easier to work with than others.
Your data will be easier to work with in R if it follows three rules:
Each variable is saved in its own column
Each observation is saved in its own row
Each value is placed in its own cell
5.5 Data nomenclature
In order to handle data in R, data are confined in objects named dataframes. A dataframe is a matrix of data, with rows and columns. These data could be of different types: numerical value (1234; 42; …), a string of characters (“Hector”; “Datamining”; …), a logical input (TRUE or FALSE) or no data (NA). You will need to tell your RStudio console which type of data is each column of your dataset. All your dataframes are located in the top right-hand panel, under the tab Environment.
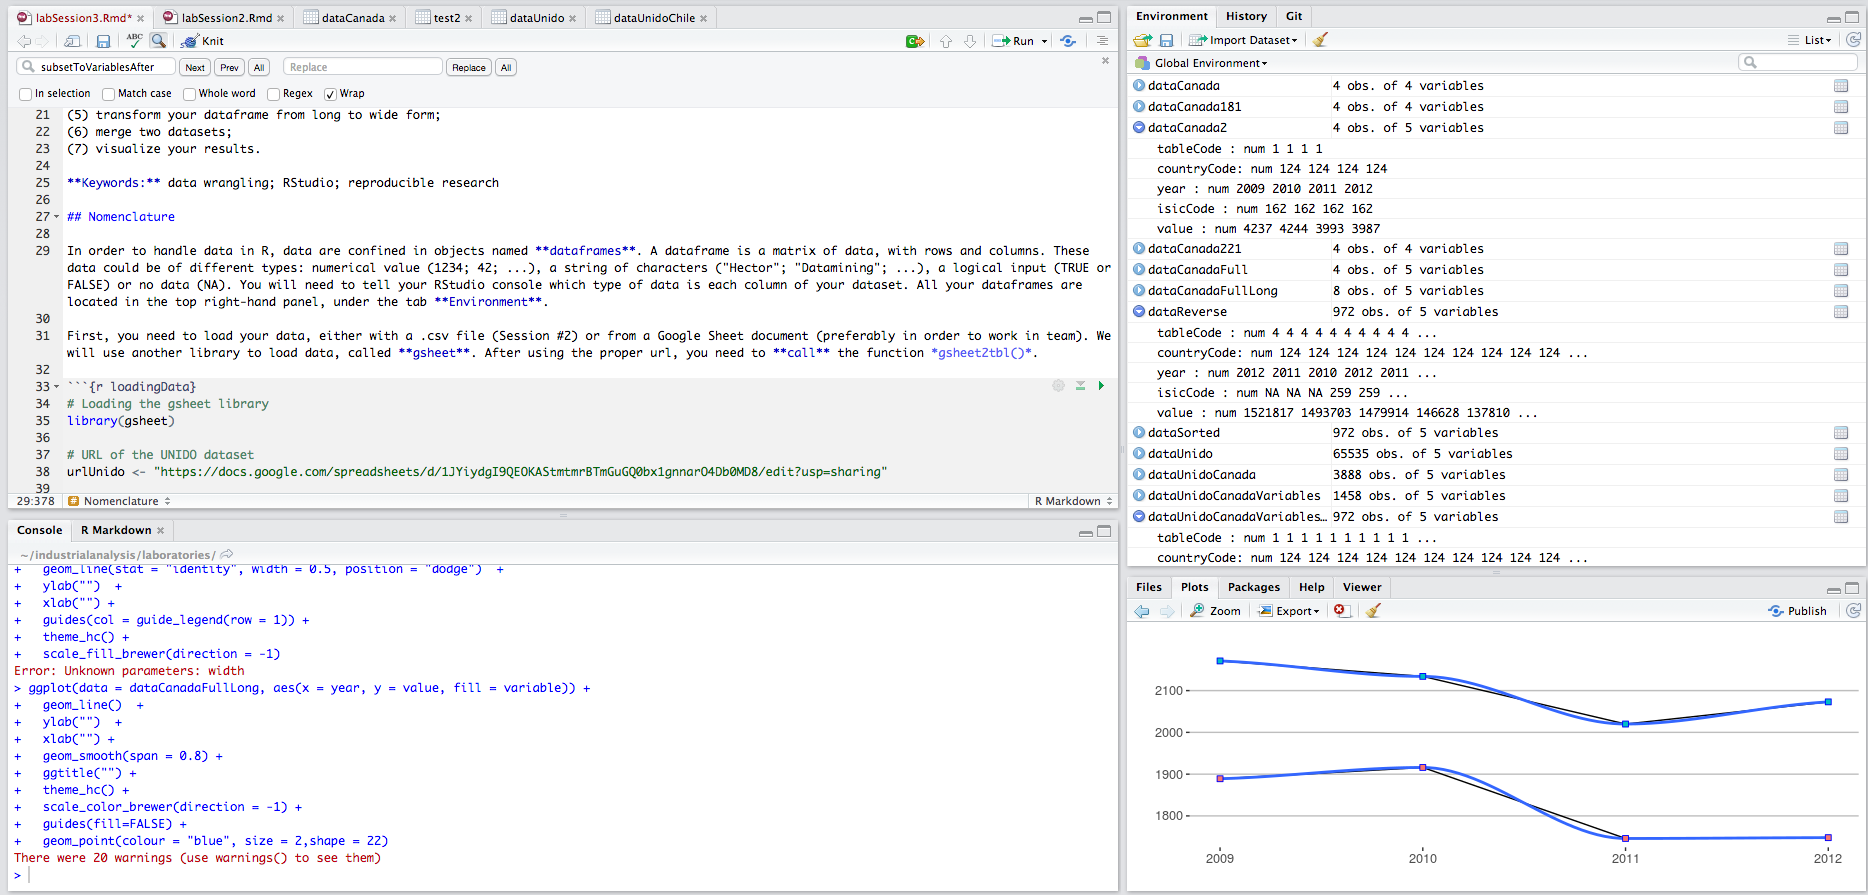
First, you need to load your data, either with a .csv file (Importing Data From a .csv file) or from a Google Sheet document preferably in order to work in team (Importing Data From a Google Sheet). For this lab, we will use a Google Sheet document so, the package gsheet. After using the proper url, you need to call the function gsheet2tbl().
We put the url in the gsheet2tbl() fuction.
# Loading the gsheet package
library(gsheet)
# Using the gsheet2tbl function to import the UNIDO dataset into the RStudio console
dataUnido <- gsheet2tbl("https://docs.google.com/spreadsheets/d/1uLaXke-KPN28-ESPPoihk8TiXVWp5xuNGHW7w7yqLCc/edit#gid=416085055")
# First 6 lines of the dataset
head(dataUnido)Sometimes, you’ll need to assign a certain type of data. For numbers, the type numeric and for letters either character or factor.
To change a column containing numbers into a numeric type, you need to use the function as.numeric(). In order to manipulate a column, you must use a specific typology, with the symbol $: dataframe$column.
Even if our columns are already in the correct type, we will do it as an example.
# Transformation from character to numerical values
dataUnido$tableCode <- as.numeric(dataUnido$tableCode)
dataUnido$countryCode <- as.numeric(dataUnido$countryCode)
dataUnido$year <- as.numeric(dataUnido$year)
dataUnido$isicCode <- as.numeric(dataUnido$isicCode)
dataUnido$value <- as.numeric(dataUnido$value)
# Structure of the dataframe
summary(dataUnido)If you want to change a column to a character type, you have to use the function as.character().
TL;DR
## Package::function()
dataUnido <- gsheet::gsheet2tbl("https://docs.google.com/spreadsheets/d/1uLaXke-KPN28-ESPPoihk8TiXVWp5xuNGHW7w7yqLCc/edit#gid=416085055")
## Library(package)
library(gsheet)
dataUnido <- gsheet2tbl("https://docs.google.com/spreadsheets/d/1uLaXke-KPN28-ESPPoihk8TiXVWp5xuNGHW7w7yqLCc/edit#gid=416085055")
## Piping
library(dplyr)

dataUnido %>%
  glimpse()
## Dense summary
dplyr::glimpse(dataUnido)
## Data nomenclature
# Loading the gsheet package
library(gsheet)

# Using the gsheet2tbl function to import the UNIDO dataset into the RStudio console
dataUnido <- gsheet2tbl("https://docs.google.com/spreadsheets/d/1uLaXke-KPN28-ESPPoihk8TiXVWp5xuNGHW7w7yqLCc/edit#gid=416085055")

# First 6 lines of the dataset
head(dataUnido)
# Transformation from character to numerical values
dataUnido$tableCode <- as.numeric(dataUnido$tableCode)
dataUnido$countryCode <- as.numeric(dataUnido$countryCode)
dataUnido$year <- as.numeric(dataUnido$year)
dataUnido$isicCode <- as.numeric(dataUnido$isicCode)
dataUnido$value <- as.numeric(dataUnido$value)

# Structure of the dataframe
summary(dataUnido)Code learned in this chapter
| Command | Detail |
|---|---|
| gsheet2tbl() | Download a table |
| glimpse() | Plot of R objects |
| as.numeric() | Produce an information dense summary |
| summary() | Produce result summaries |